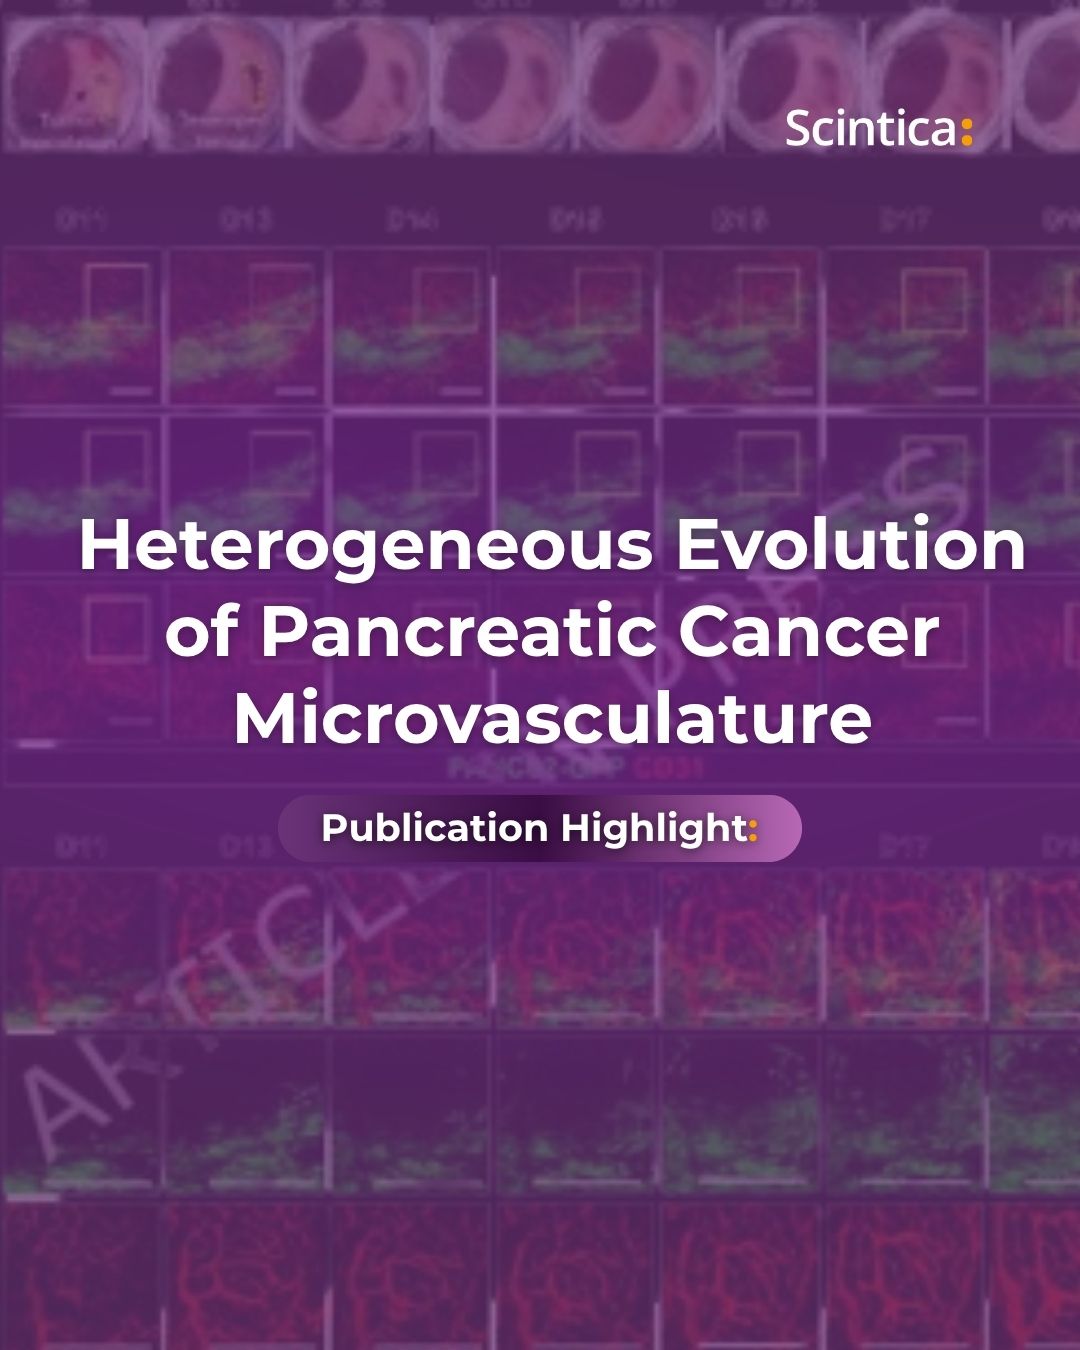
VivoQuant

Visualization, Processing, Co-Registration, and Quantification Software Suite for Imaging Data

Accessories & Add-ons

Key Features

System Overview

VivoQuant is a vendor neutral visualization, processing, co-registration, and quantification software suite; developed by scientists for their peers. It supports multi-modal and multi-species imaging, by combining essential viewing functionality with powerful tools for fine-tuning images, isolating, and analyzing regions of interest, and more. The platform supports multiple image formats to allow for visualization and analysis of both static and dynamic image data sets in DICOM as well as 30+ native data formats from various vendors.

VivoQuant is a vendor neutral visualization, processing, co-registration, and quantification software suite designed to be used with any number of imaging modalities. The software suite streamlines image analysis research studies across basic and translational research, including drug discovery.

It supports multi-modal and multi-species imaging, by combining essential viewing functionality with powerful tools for fine-tuning images, isolating and analyzing regions of interest, and much more.

Features & Benefits

Invicro, a Konica Minolta company, is an integral part of Konica Minolta’s precision medicine initiative, which aims to accelerate personalized medicine, discover novel therapeutic targets and develop innovative therapeutic technologies for unmet medical needs

Fully DICOM compatible; along with 30+ other vendor specific formats

Users may import image data from any number of preclinical imaging systems, support for both static and dynamic data sets

Multi-modality support

VivoQuant supports and overlays data from most imaging modalities including MRI, PET, SPECT, CT, and optical imaging

Integrated image analysis tools

Improve analyses using the multi-atlas segmentation (MAS) tool, K-Means Segmentation Algorithm, and Cortical Thickness Tool 

Three-dimensional rendering function

Apply balancing, shading, orientation, color, and lighting parameters to enhance 3D image renderings for presentations and publications. (3D ROI) 

The VivoQuant software was developed by scientists for their peers, providing a robust and flexible visualization and quantification tool. The platform supports multiple image formats to allow for visualization and analysis of both static and dynamic image data sets in DICOM as well as 30+ native data formats from various vendors.

Co-registration of multi-modal images can be done automatically or manually, with additional tools to aid in processing the images, including filtering, cropping, smoothing, and re-sampling.

Region of interest segmentation can again be done automatically, semi-automatically, or manually; while advanced modules are available, such as the 3D Brain Atlas Tool to allow scientists more automation in their workflows. 

 VivoQuant allows users to program their own workflows to reduce user interaction, and to allow for batch image processing. Further, VivoQuant integrates with iPACS to further empower scientists to handle their imaging data and resulting quantification. 

Accessories & Add-ons

There are a selection of add-ons available within the VivoQuant software, and those which integrate with the software suite as well:

3D Brain Atlas Tool
This tool is designed for automatic segmentation of brain image data. Automated fusion routines register an application-specific brain atlas to preclinical image data and advanced statistical analysis methods are employed to provide rapid and thorough region-specific volume and uptake quantification.

The tool can handle CT or MRI data as the input, and MRI, PET, or SPECT for the functional data.
Multi-Atlas Segmentation Tool
This tool generates regions of interest by registering a series of images in a Reference Library to the image that has been loaded in the Data Manager.

The Reference Images must each have a corresponding ROI. The tool registers the images in the Reference Library to the loaded data and applies the same transformation to the corresponding ROI. The tool then works on a voxel-by-voxel basis, classifying a voxel to the new ROI if a greater percentage of the reference sets classified that voxel as within the ROI than the threshold percentage set by the user.
Pharmacokinetic Modeling Tool
This tool allows the user to assess pharmacokinetics within their acquired image.

This tool includes Two-Tissue Compartment Model (2TCM), One-Tissue Compartment Model (1TCM), Logan Graphical Method, Simplified Reference Tissue Model 1 & 2 (SRTM/SRTM2), and other models.
Integration with iPACS
iPACS is a web-based project management system designed for in vivo imaging applications. The iPACS study management analysis software is a sophisticated, time-saving, web-based resource designed for imaging laboratories.

iPACS offers a wide range of functionality for the organizational, processing, reporting, and regulatory needs of preclinical and clinical imaging efforts. World-wide internet access allows users to collaborate seamlessly.

Publications & Articles