Imaging Gallery
Modality
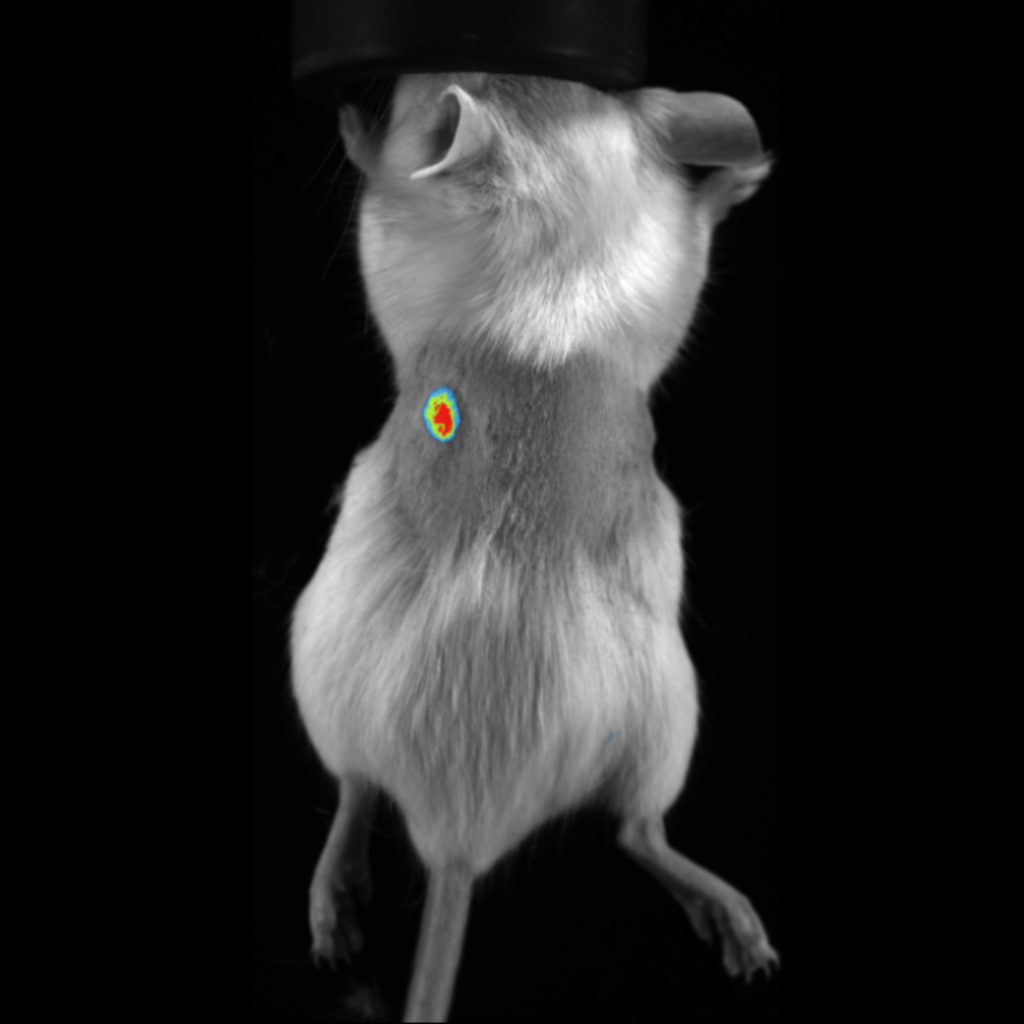
FL Image
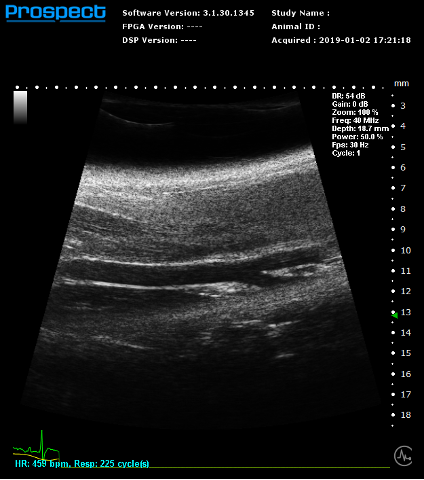
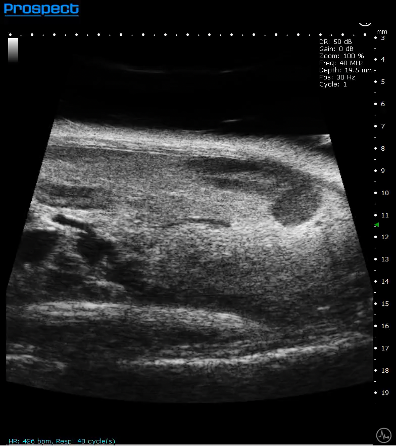
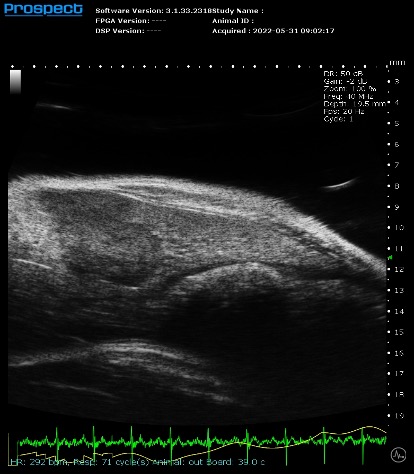
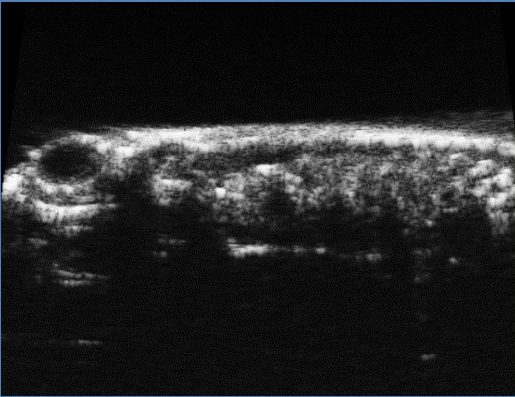
B-Mode of Rat Carotid Artery
B-Mode of Rat Carotid Artery
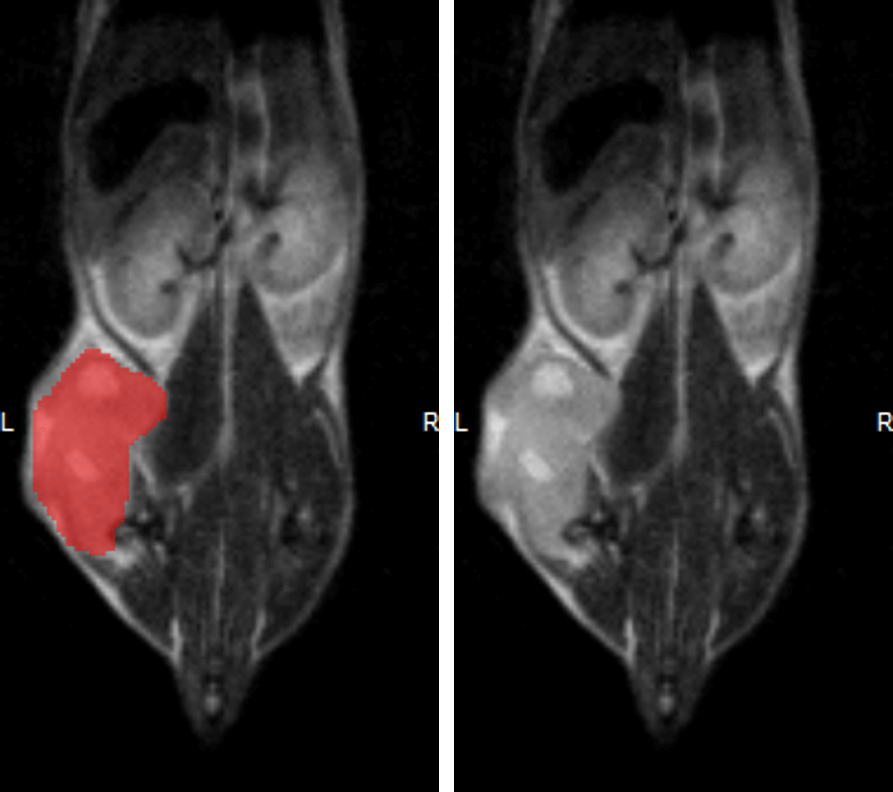
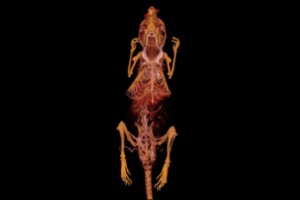
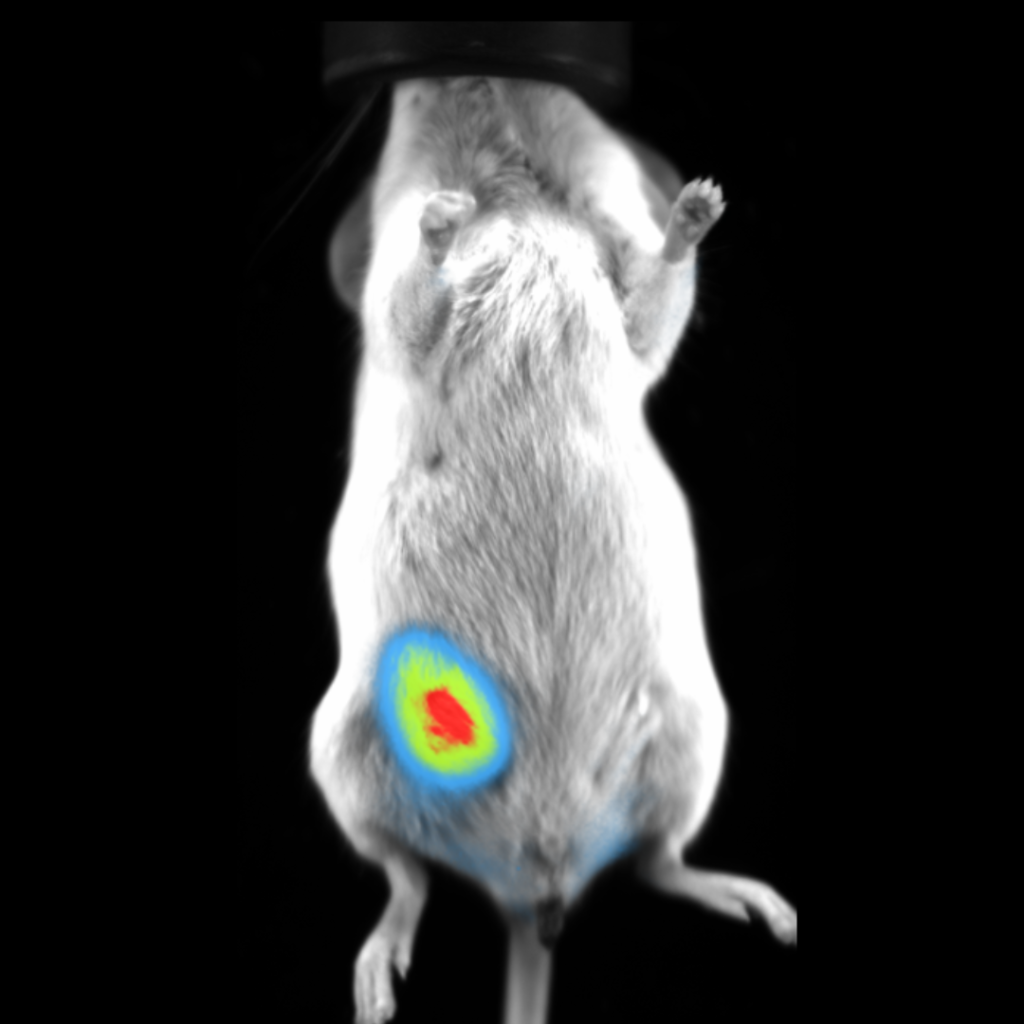
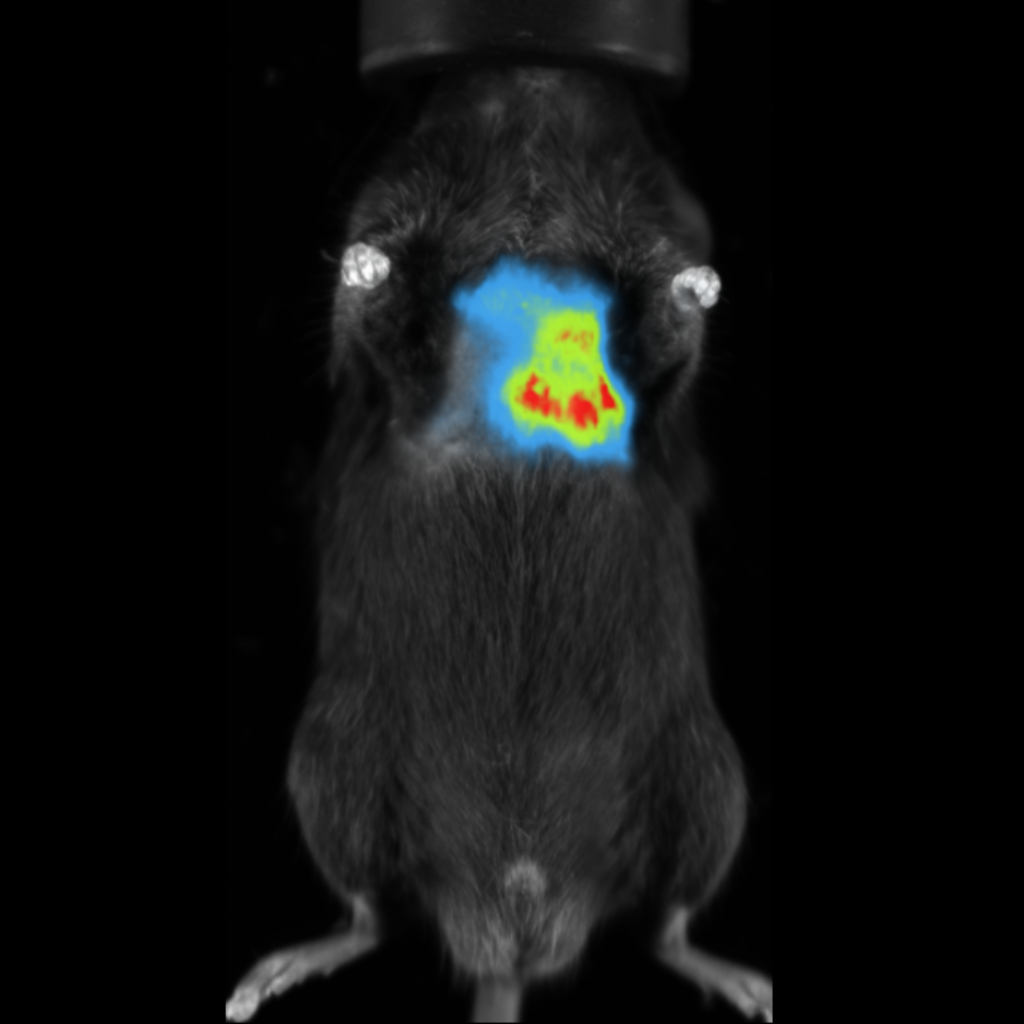
mouse-cancer-xenograft (1)
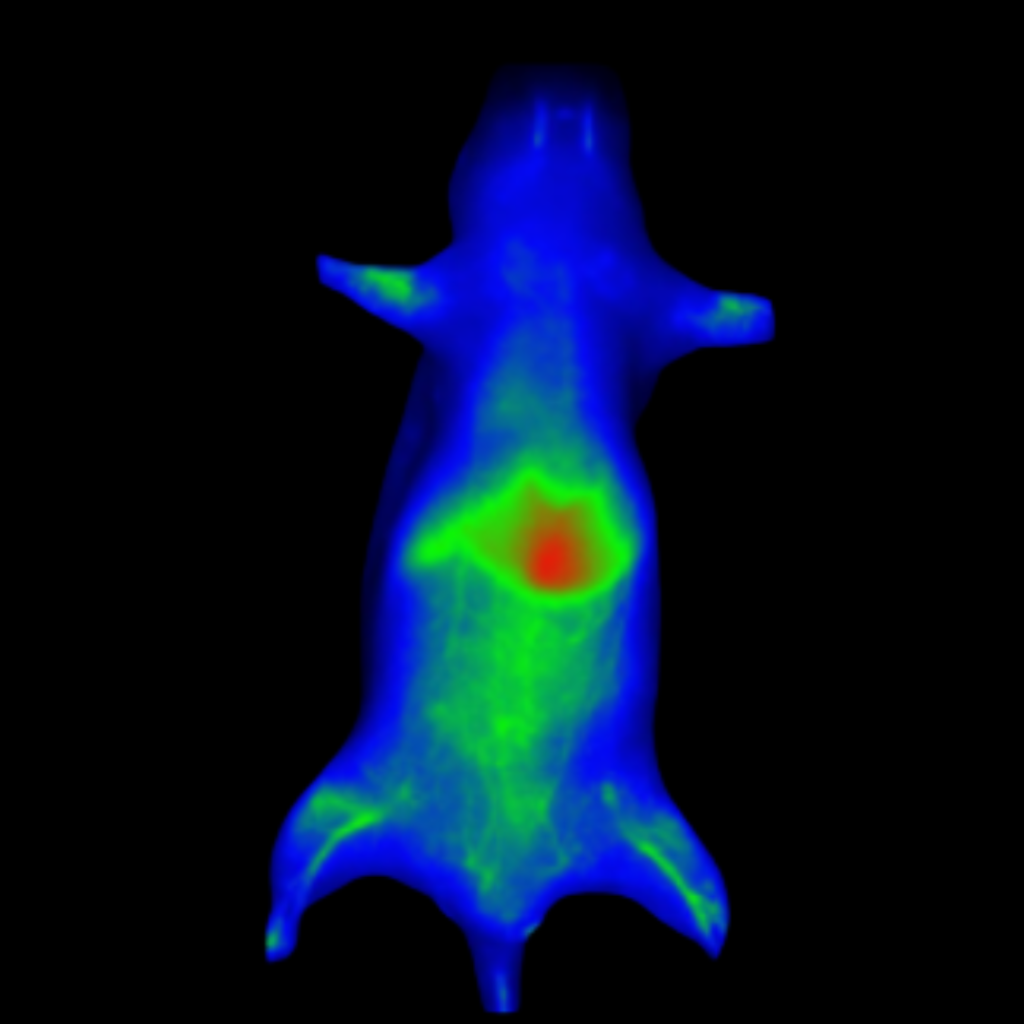
Hindlimb tumor growth
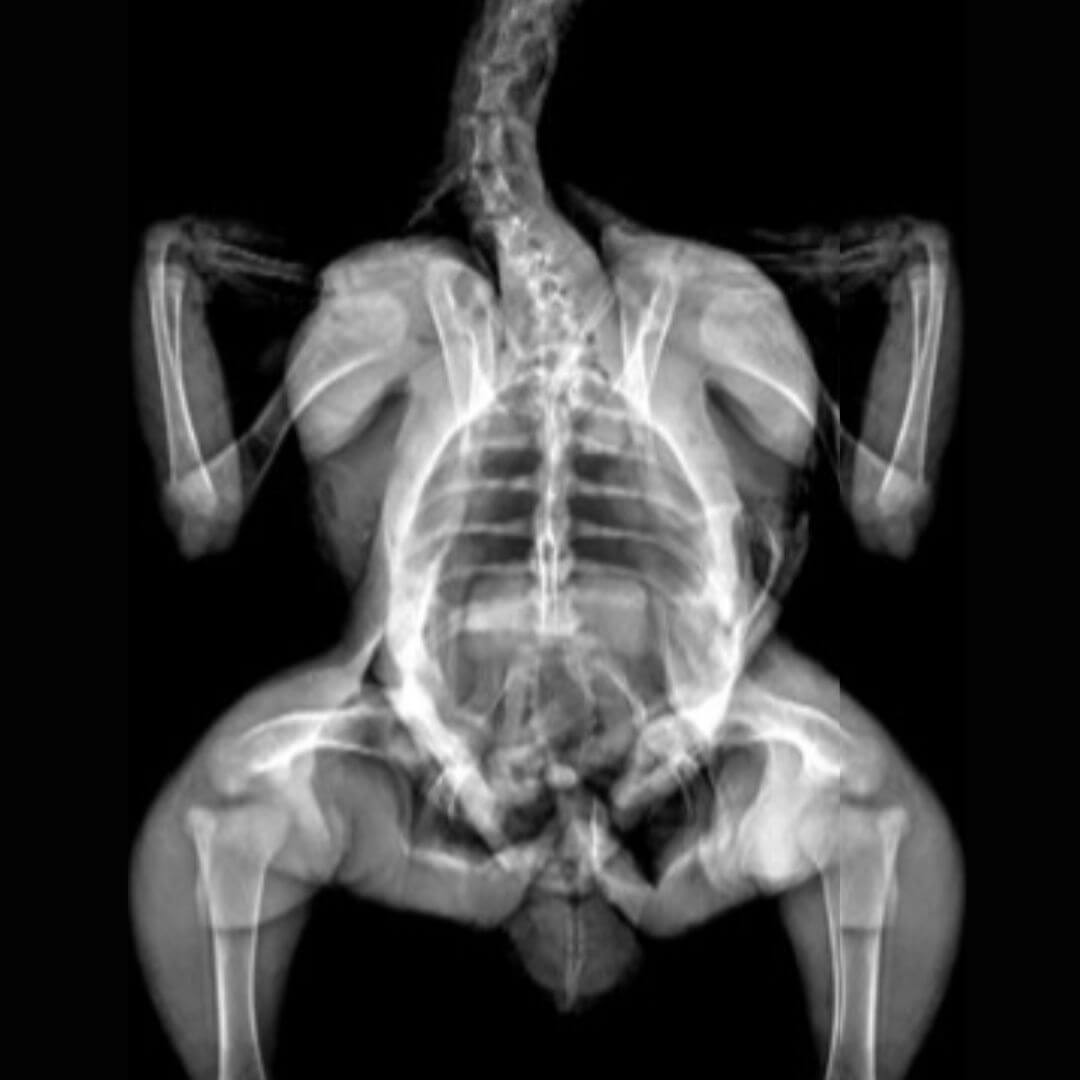
DXA Chicken
Chicken X-Ray
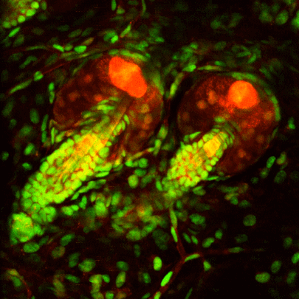
Developmental Biology
Developmental Biology
Bone Marrow
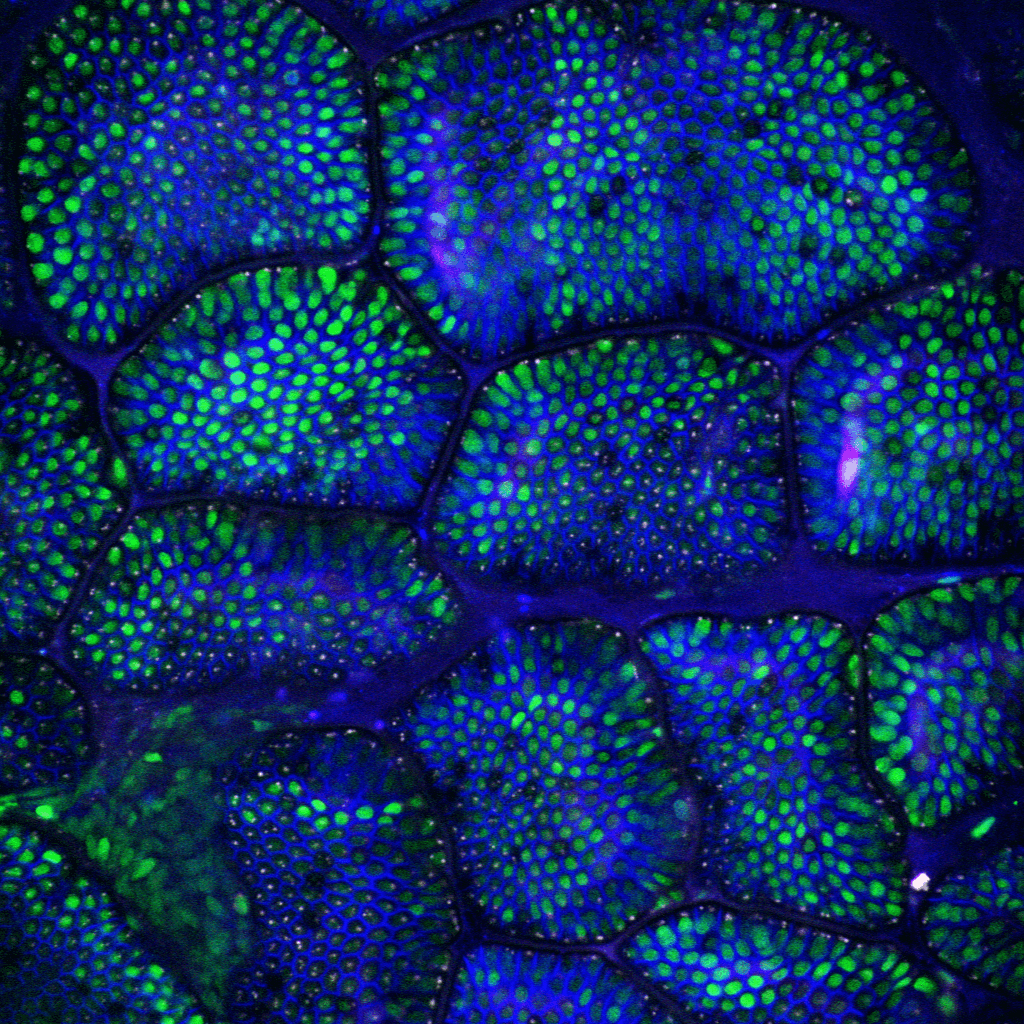
Intestine
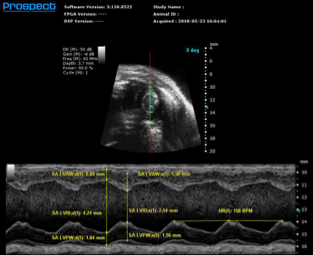
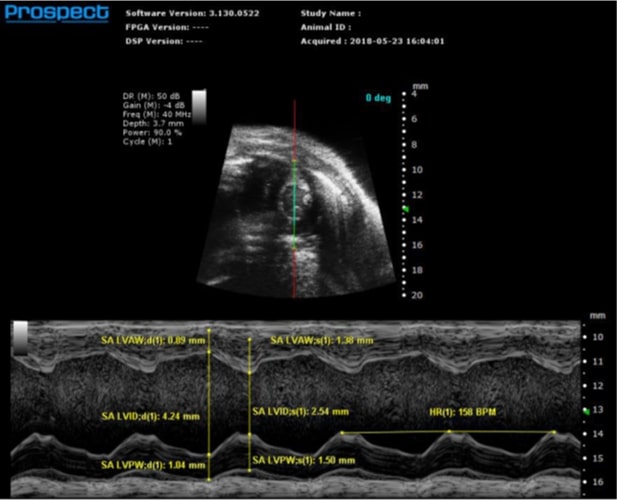
Mouse Left Ventricular Short Axis View in M-Mode
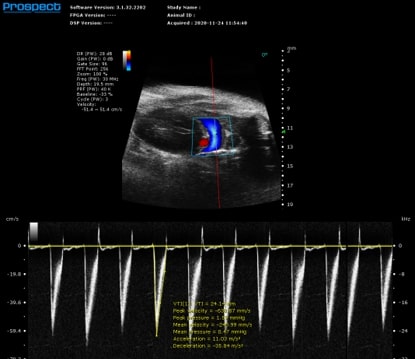
Mouse Mitral Valve Inflow in PW Doppler
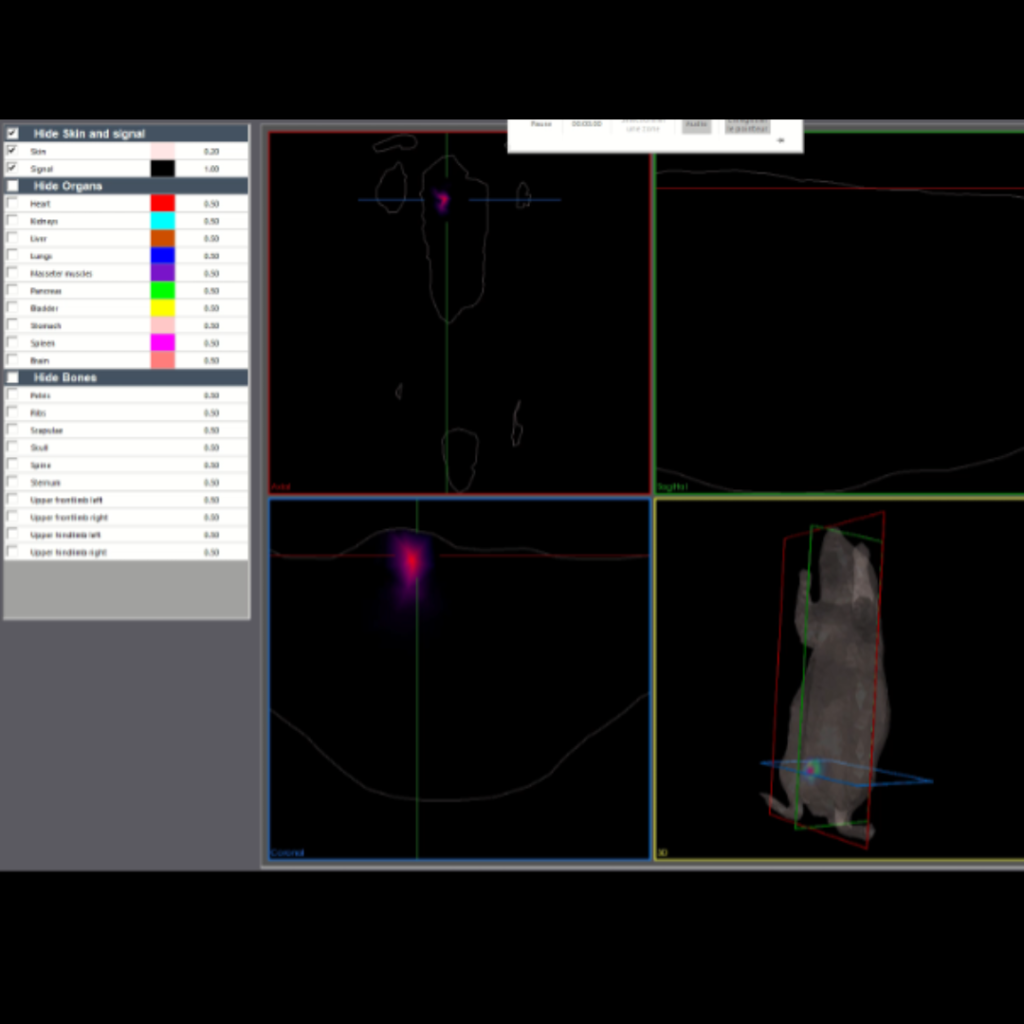
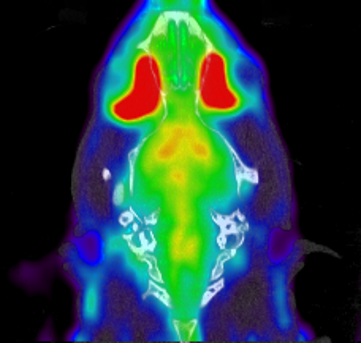
MultPlex PET
Showing only FDG signal from Combined Acquisition
PET
Lung
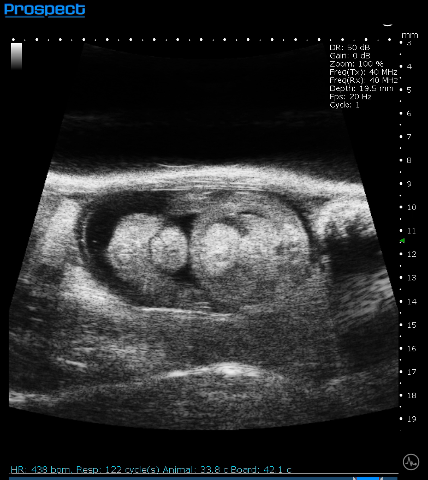
Pregnant Mouse
Pregnant mouse, visualizing mouse embryos (~1cm) in a live pregnant mouse using mouse mode with 20 second scan at 22.5 µm pixel size with 3D reconstruction
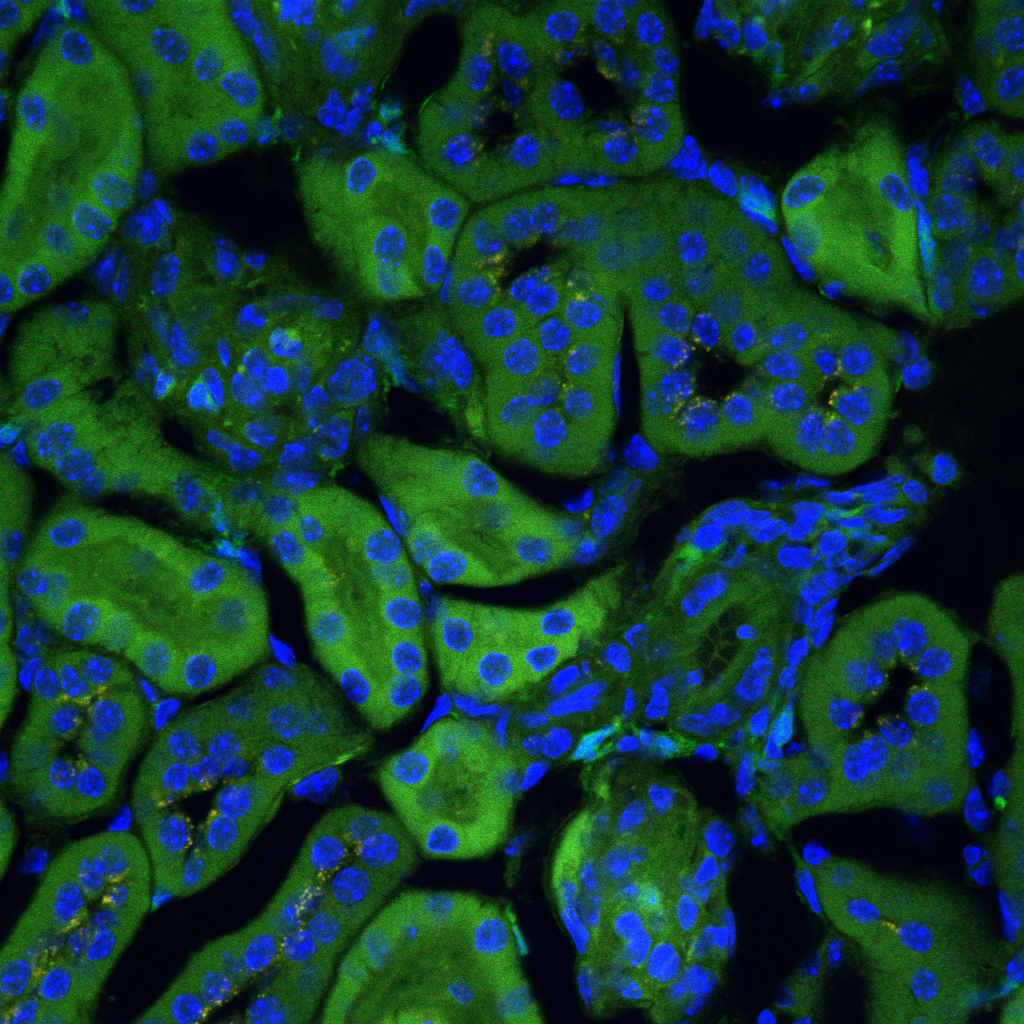
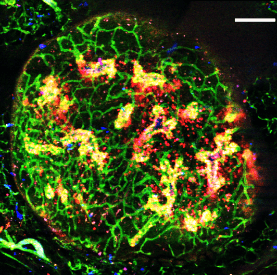
Islet Cells Transplanted into the Kidney
Contrast Mode
Contrast Mode
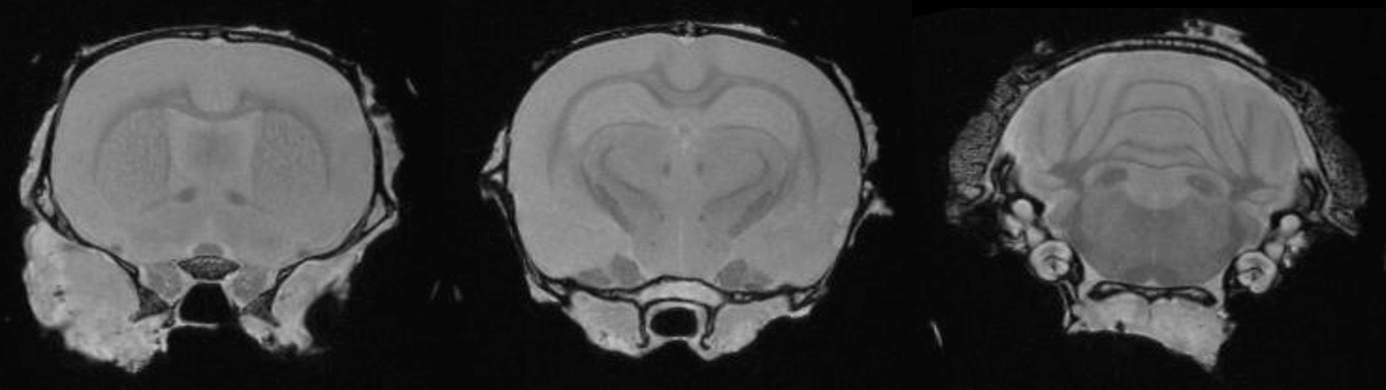
T2 Weighted Image of Normal Mouse Brain
T2 Weighted Image of Normal Mouse Brain
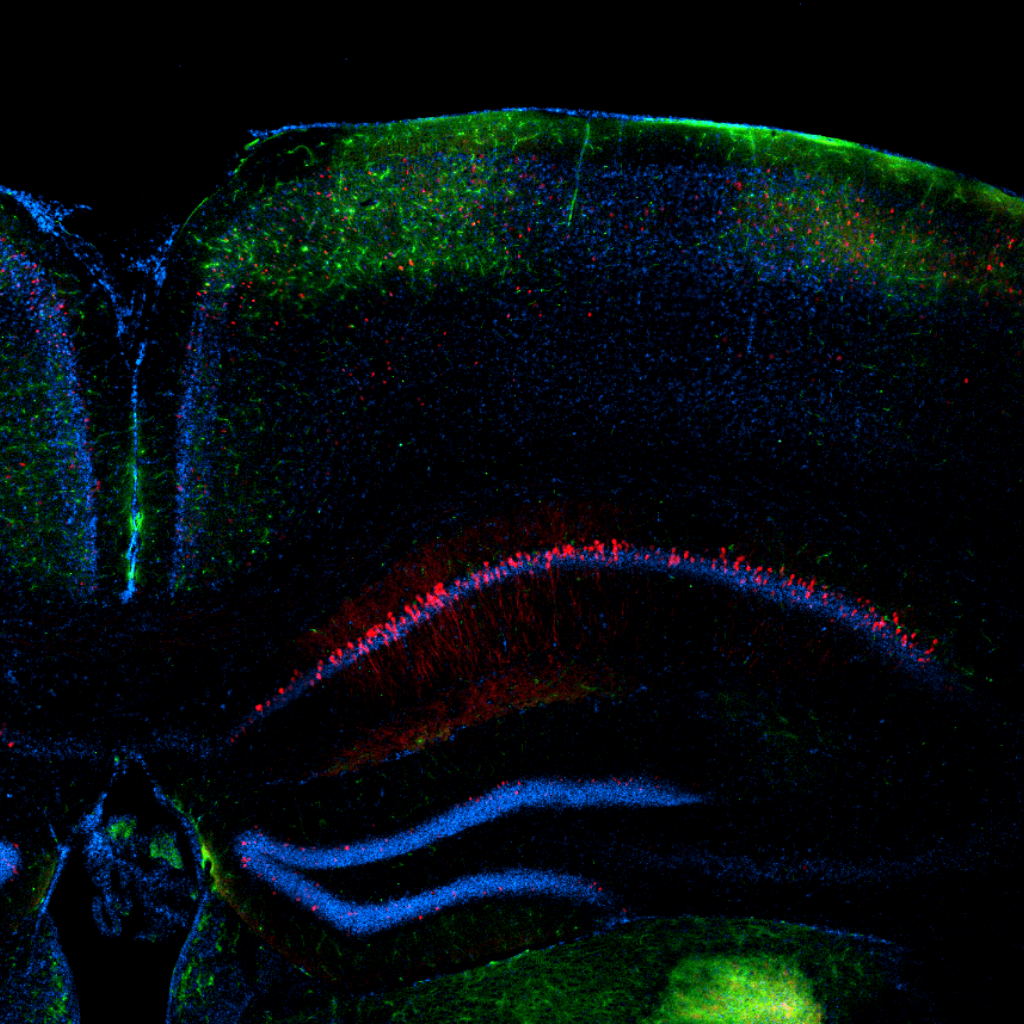
Brain
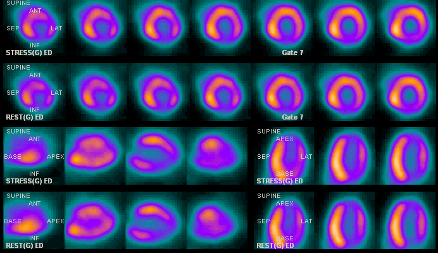
Cardiac Imaging in a Mouse
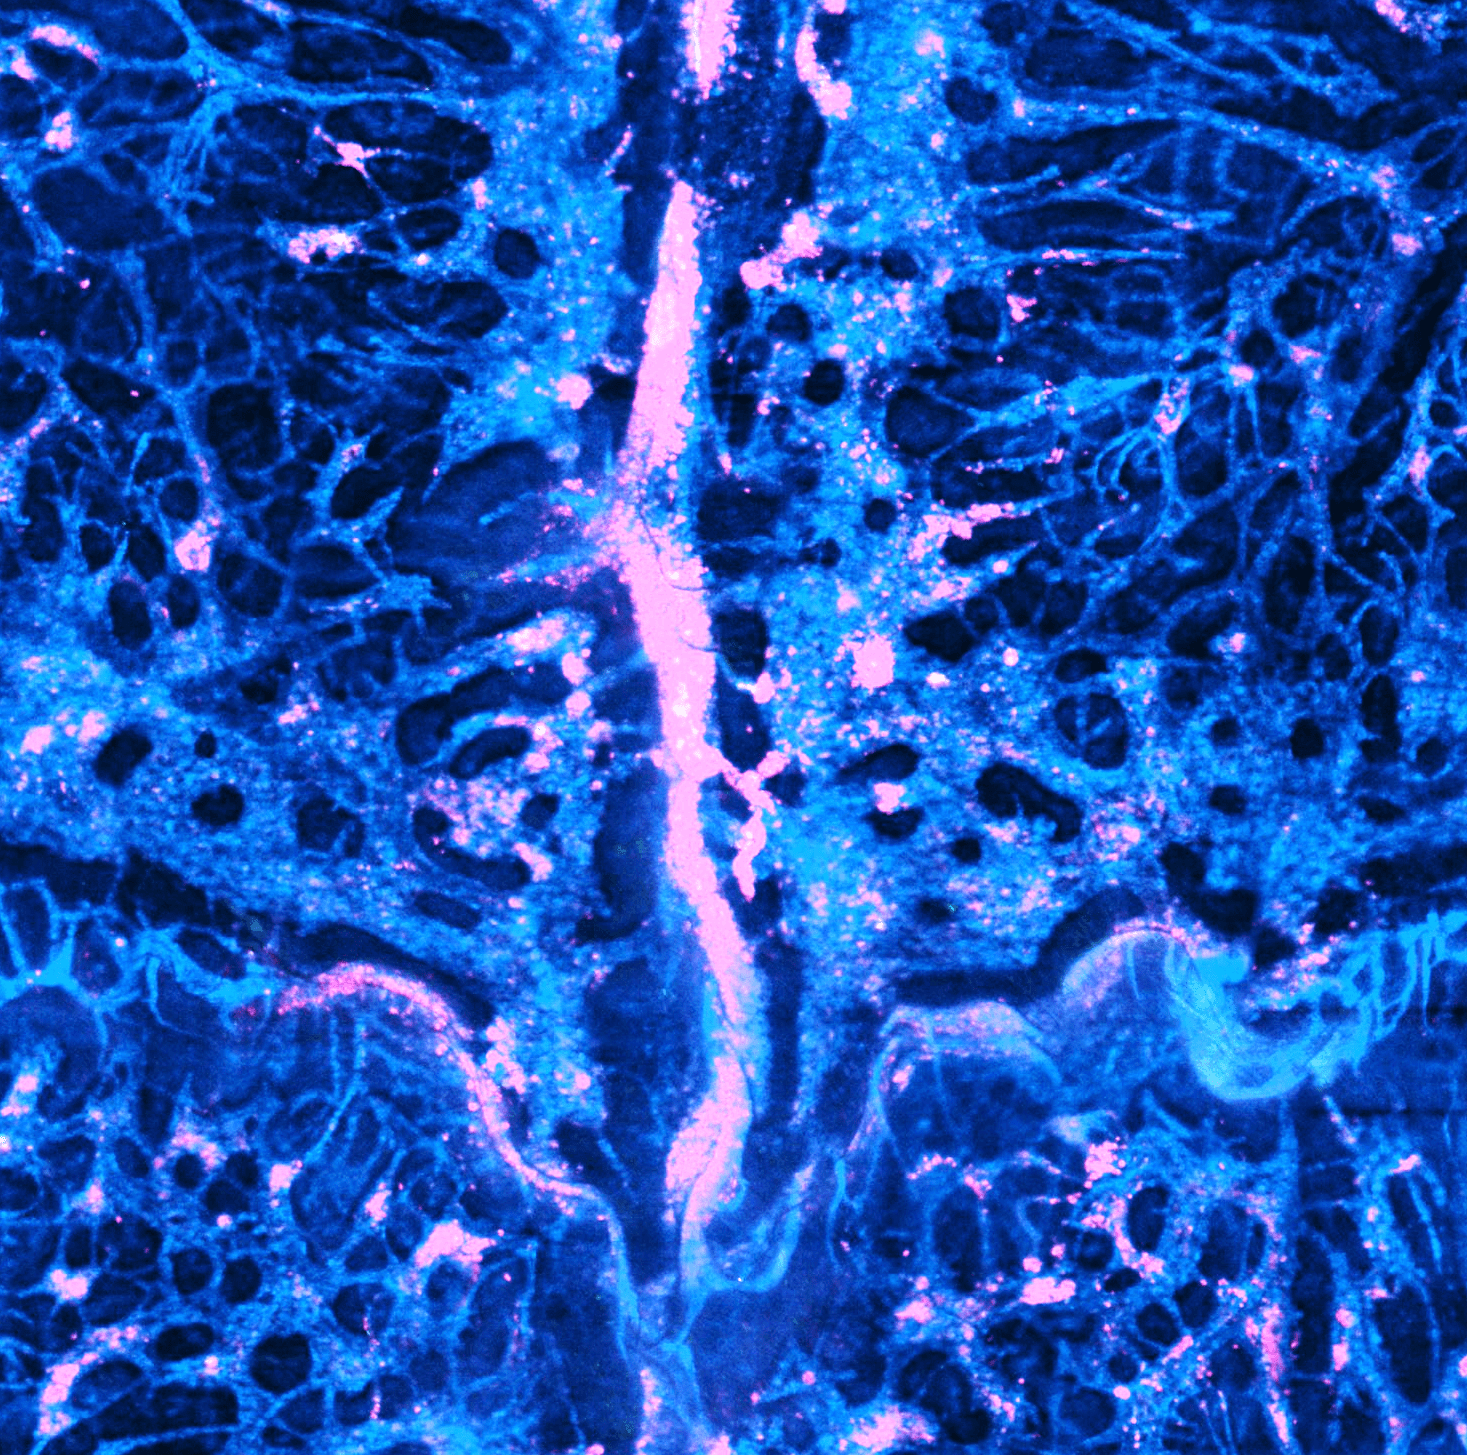
Colon Tissue
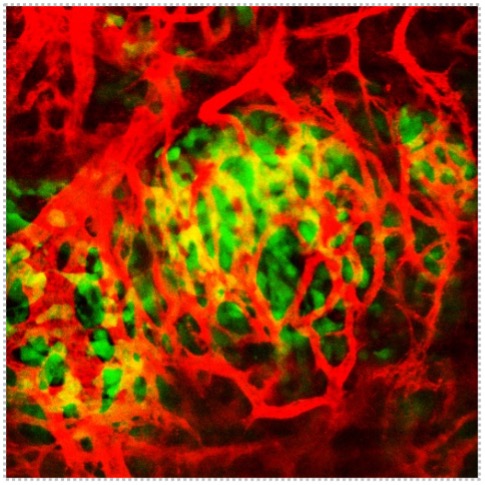
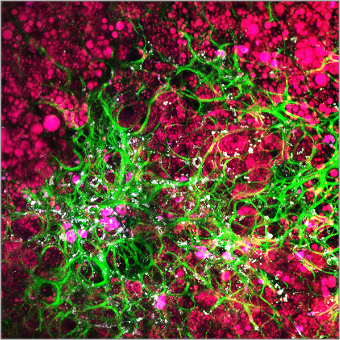
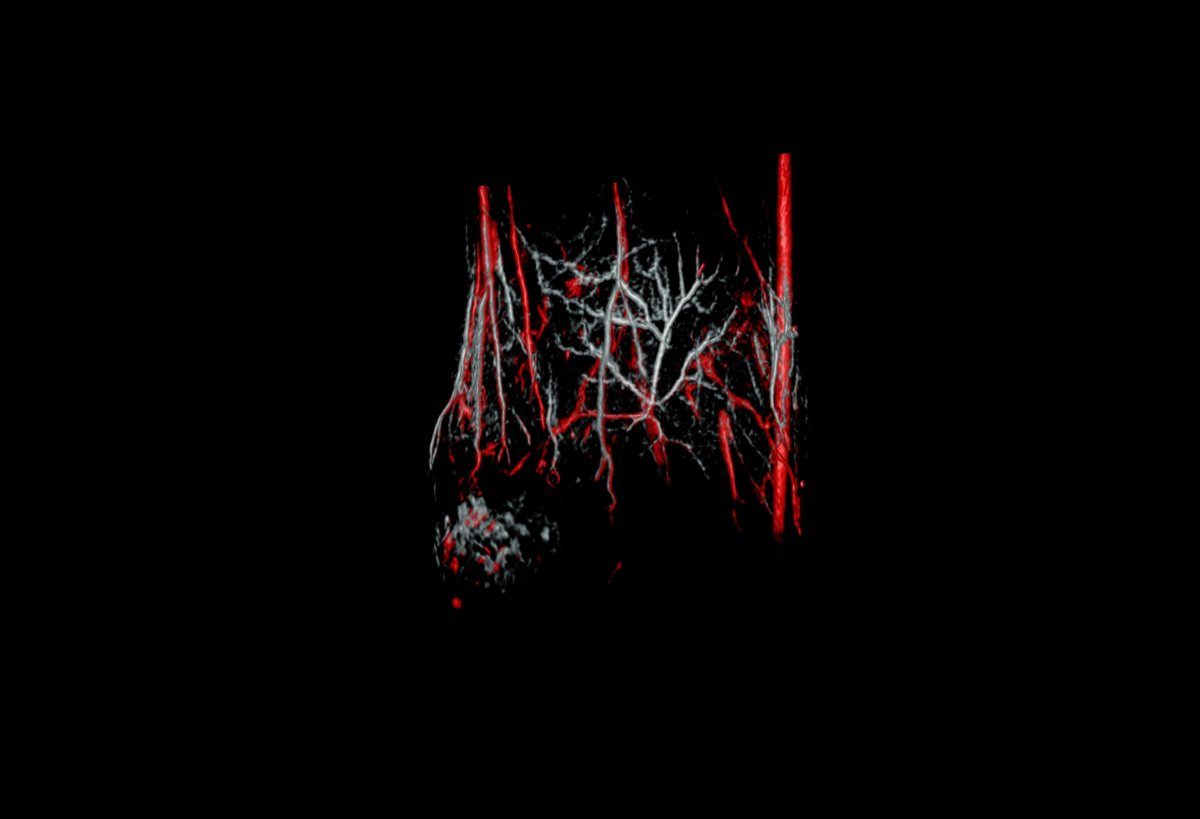
Vascularity in Lewis Lung Carcinoma Tumor Model
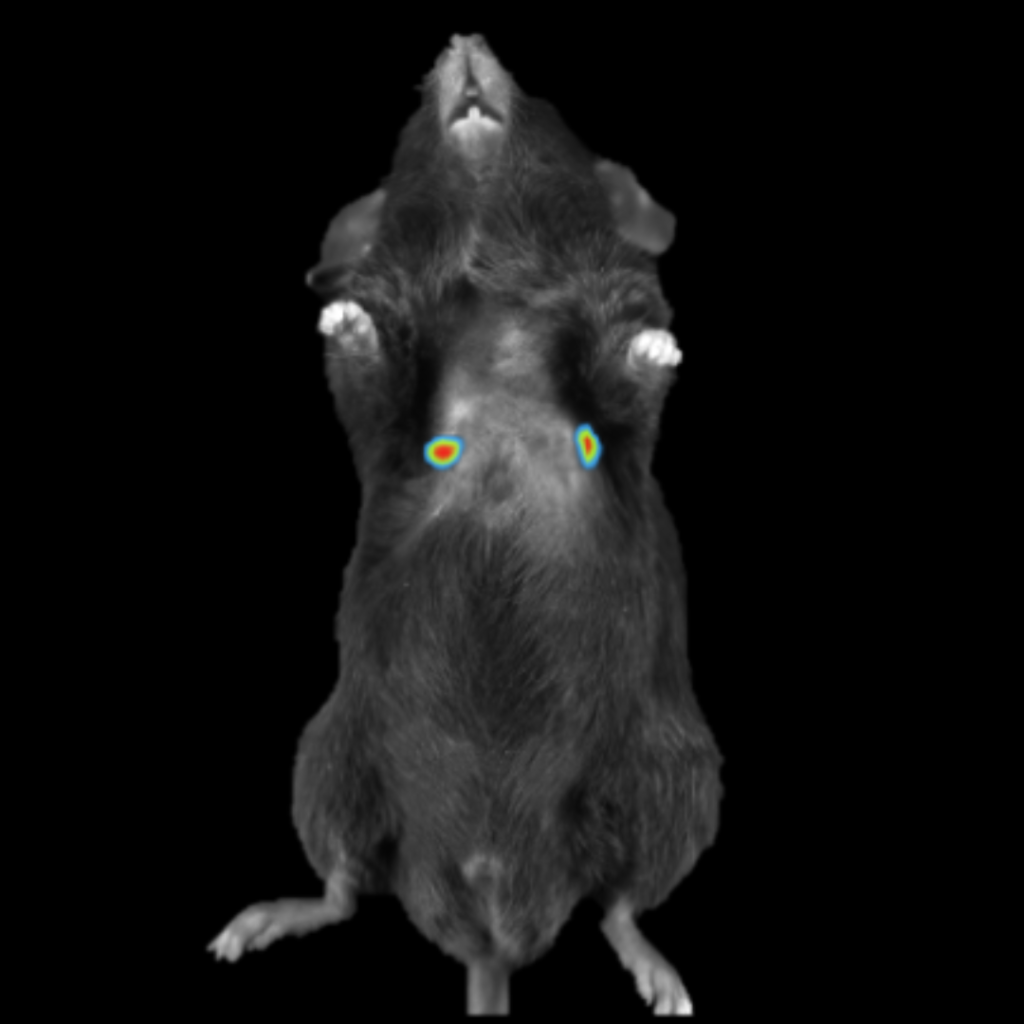
mCherry Fluorescence Imaging in Subcutaneous Tumor in Mouse
mCherry Fluorescence Imaging in Subcutaneous Tumor in Mouse
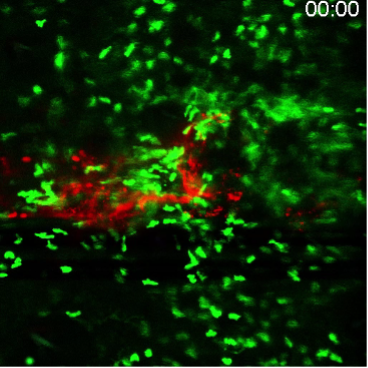
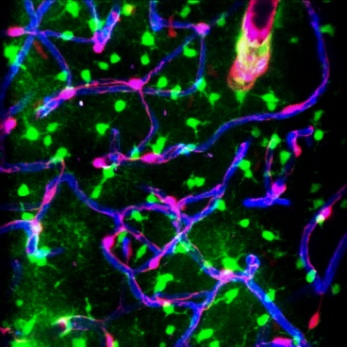
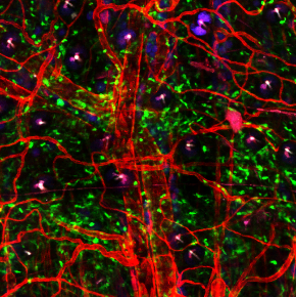
Inflammatory Response in Skin, with KARs (Killer Activated Receptors) and Granulocytes labelled
default_view_enhance_low_energy
X-Ray Attenuation Image
Mouse Mitral Valve Inflow in PW Doppler
Mouse Pulmonary Artery in PW Doppler
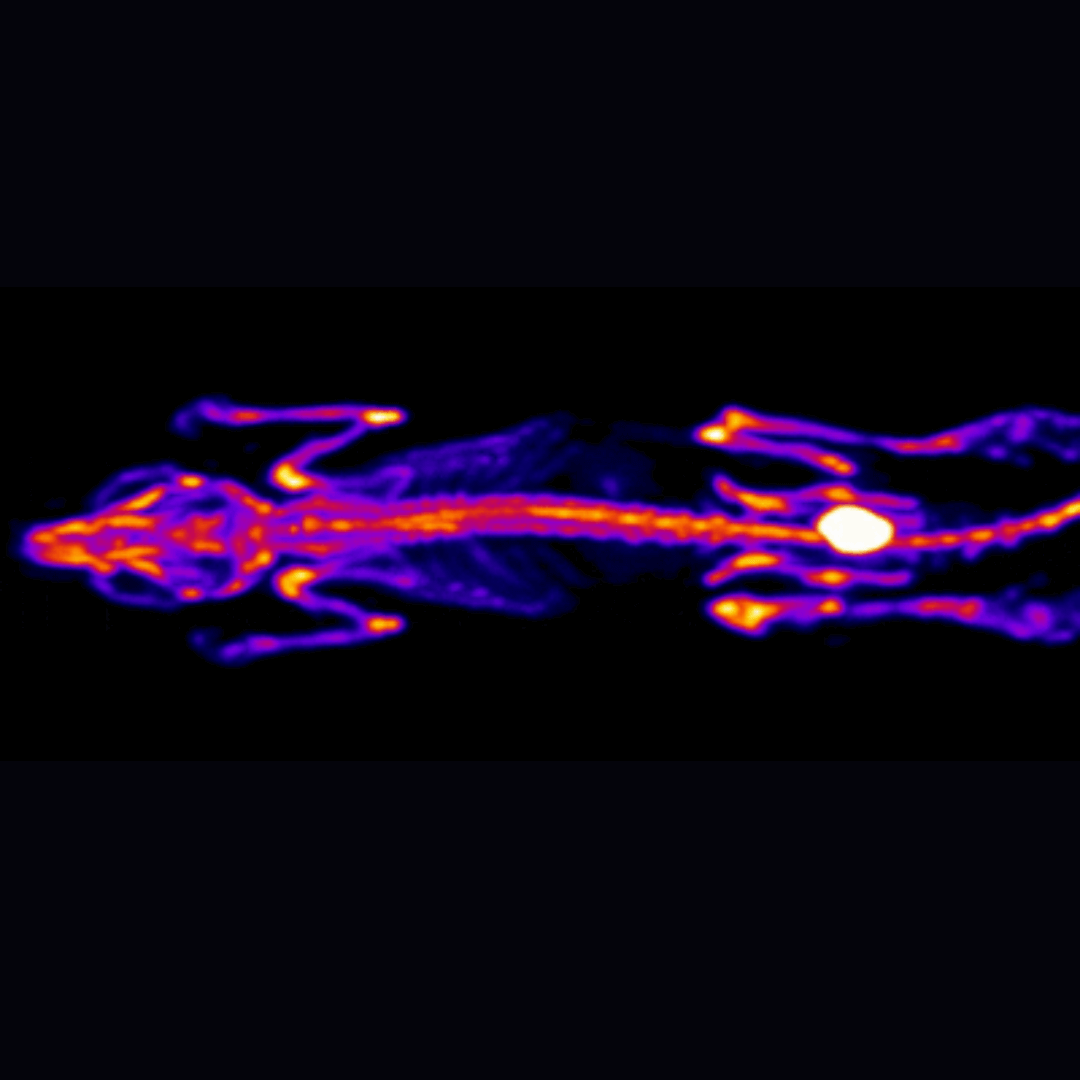
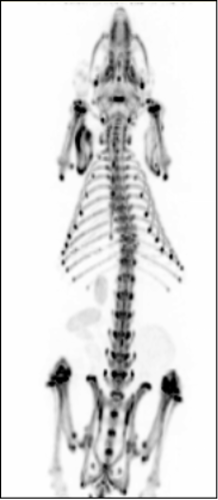
18F PET Bone Scan
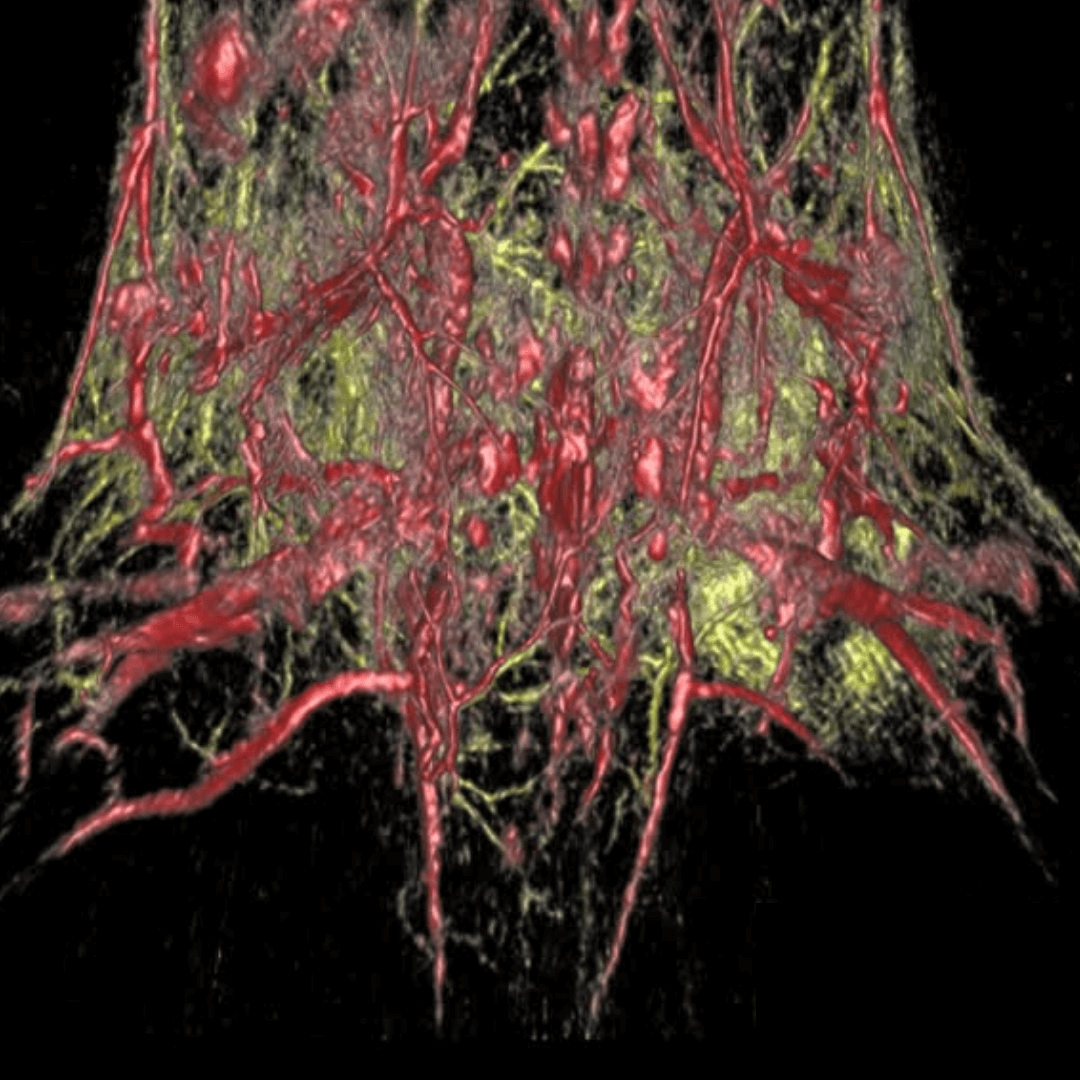
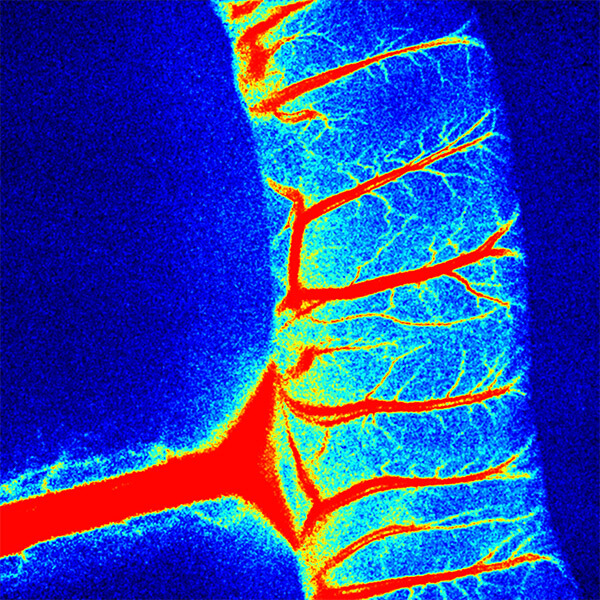
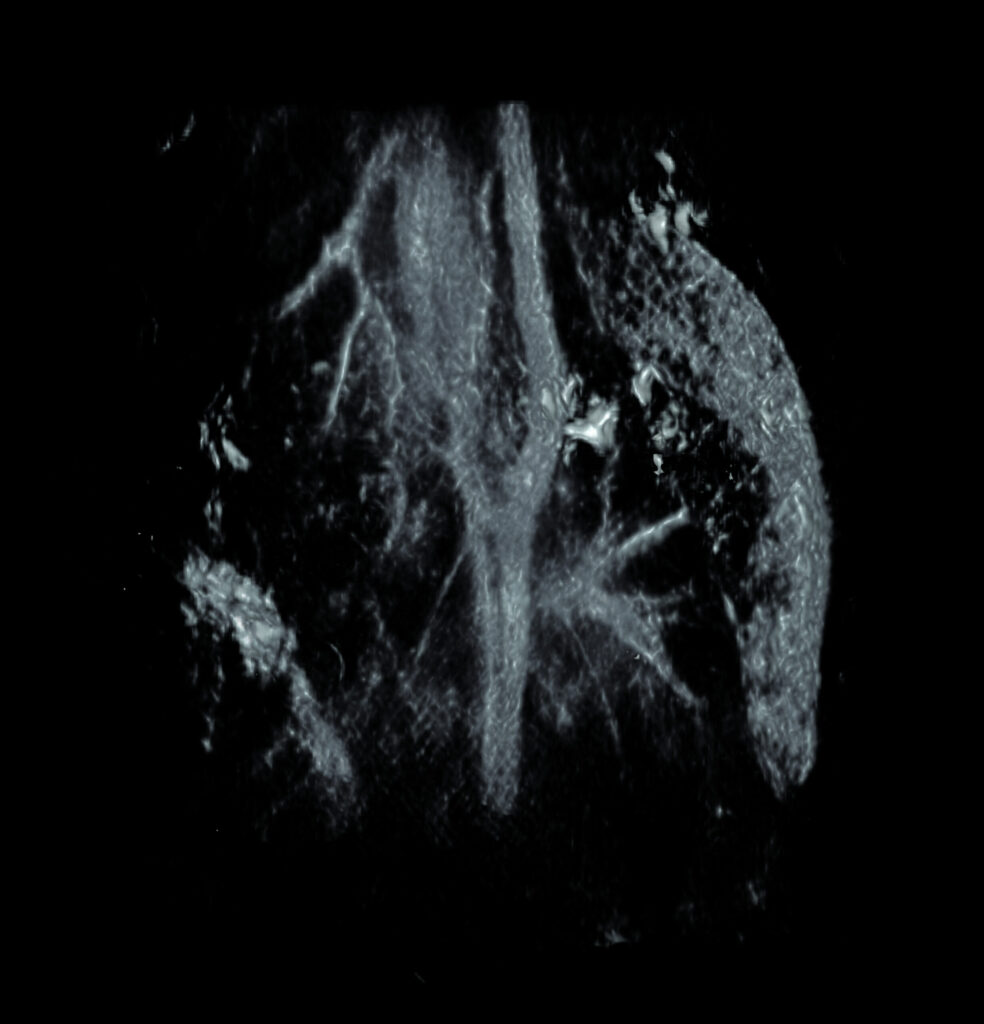
Photoacoustic Imaging
A composite TriTom image
B-Mode Image of Orthotopic Ovarian Cancer Model in a Mouse
B-Mode Image of Orthotopic Ovarian Cancer Model in a Mouse
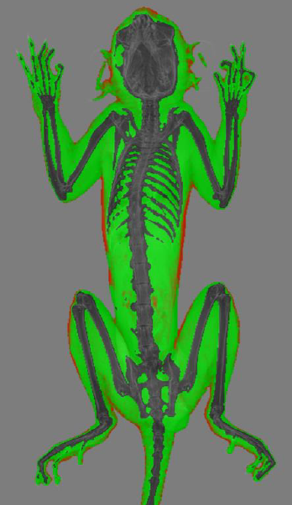
DXA-Fish
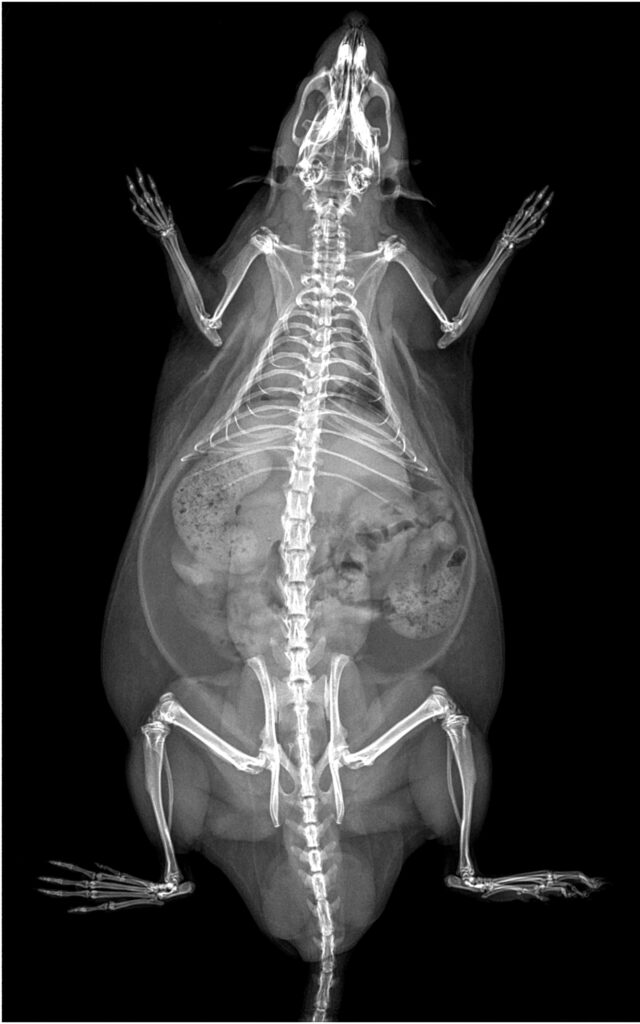
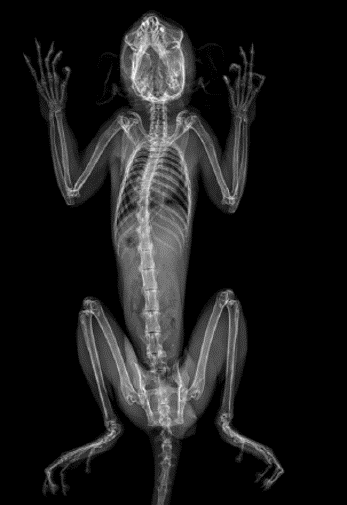
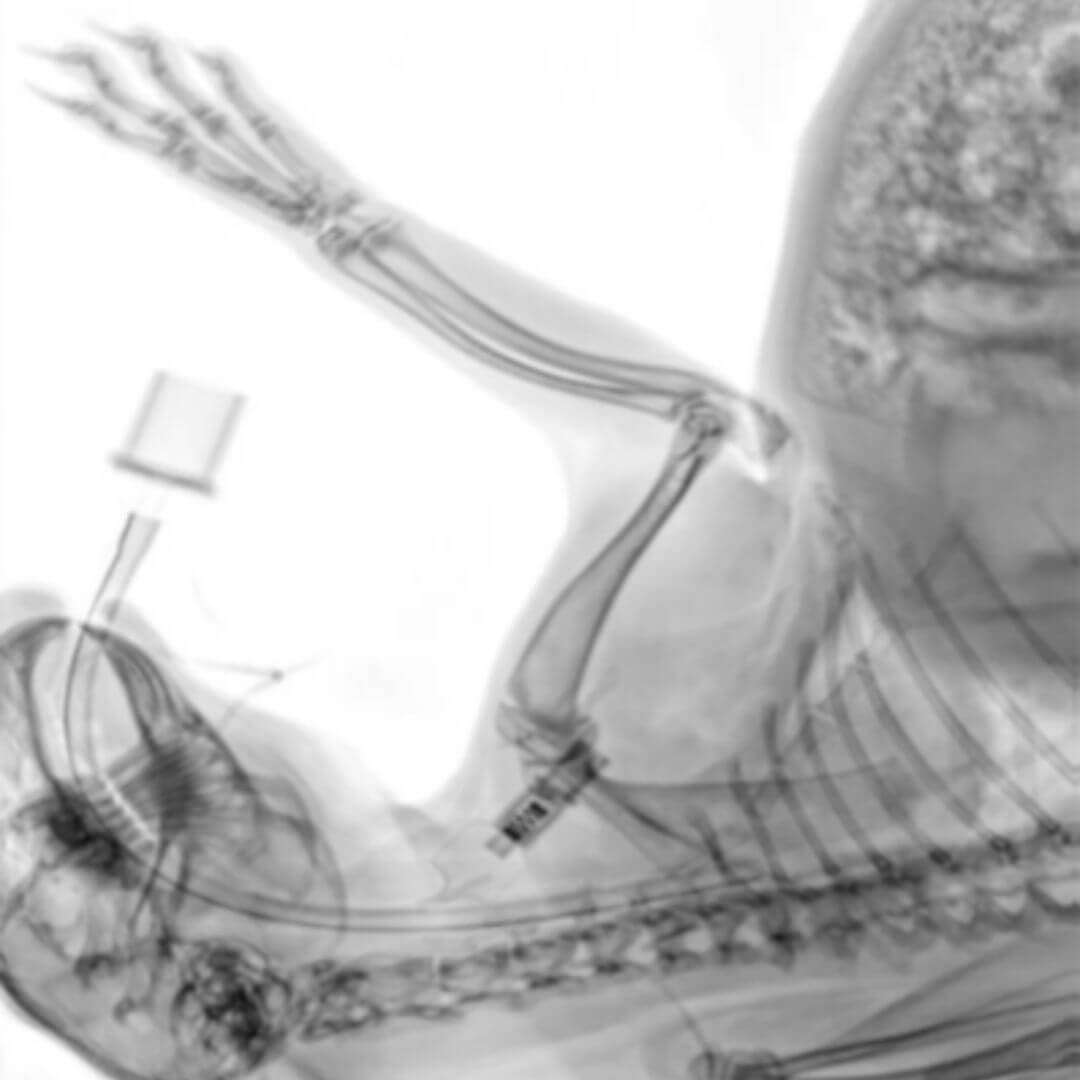
Marmoset X-Ray
Marmoset X-Ray
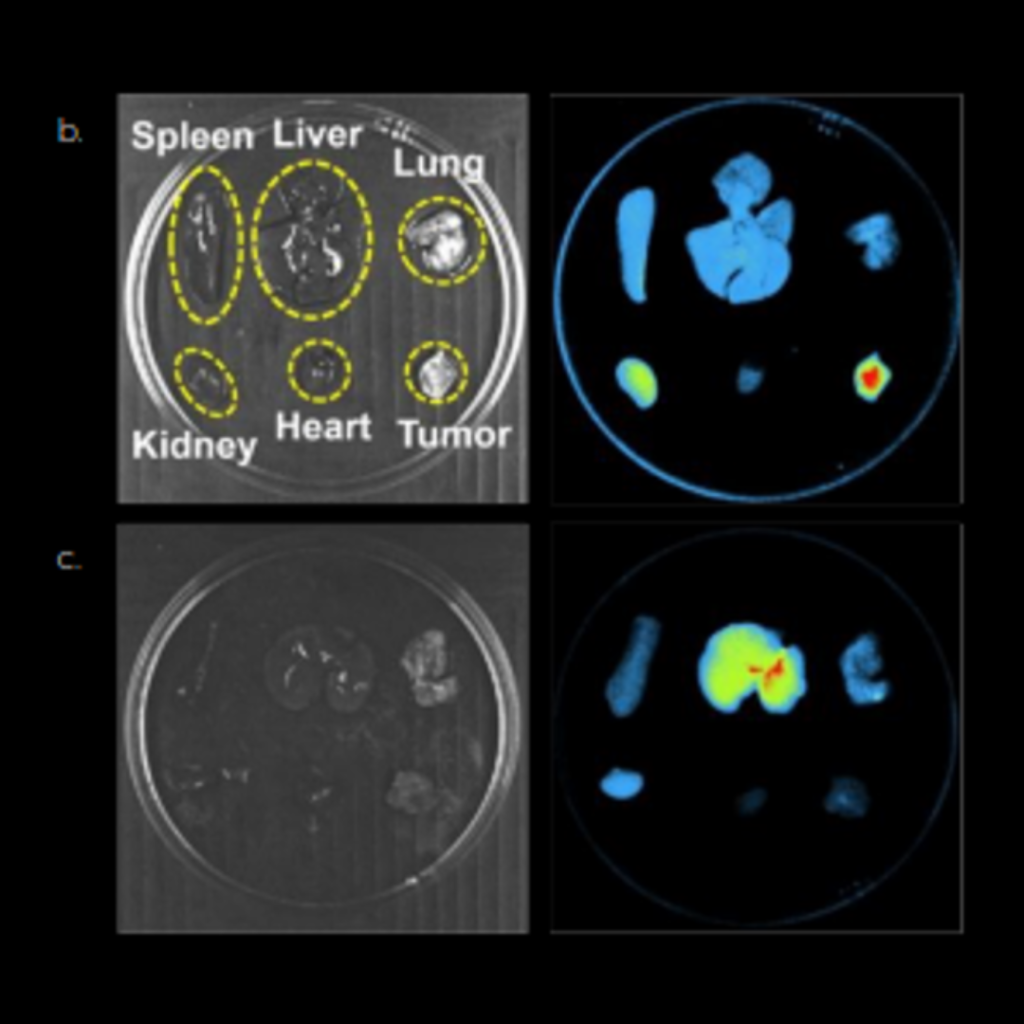
Ex Vivo Imaging of Fluorescent Nanoparticle Biodistribution
Spleen, Liver, Lung, Kidney, Heart, Tumor
SimPET6
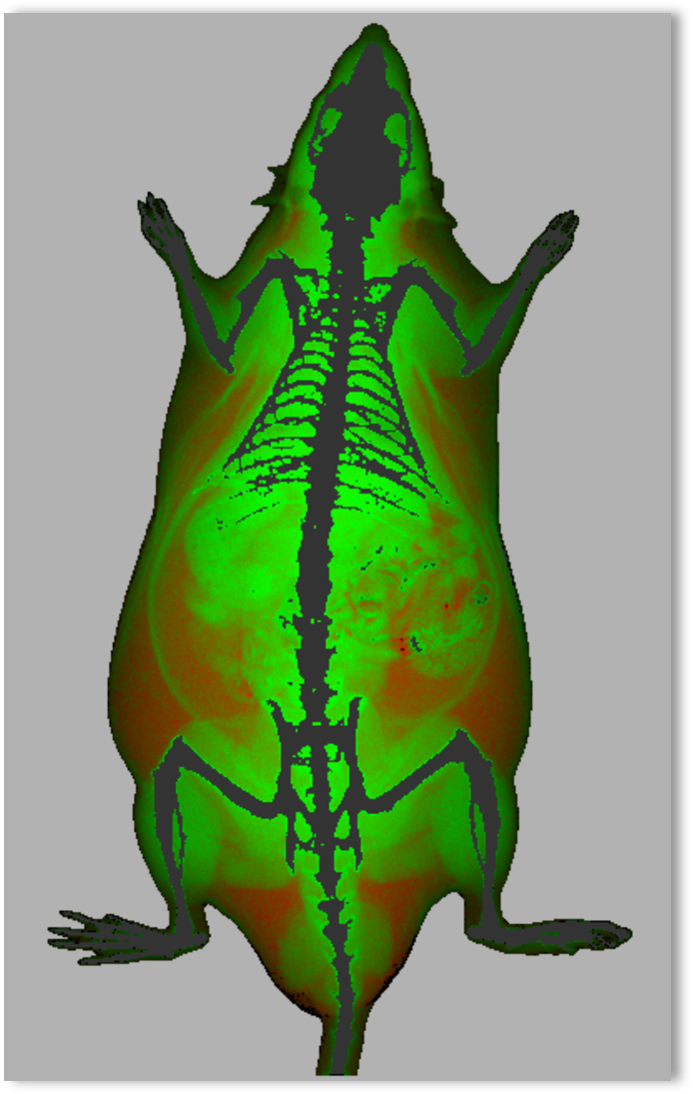
Rat Color Image
Rat Color Image
3D BLI Tomographic Imaging of Mammary Fat Pad Tumor
Adipose
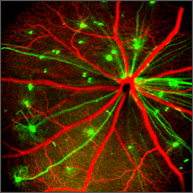
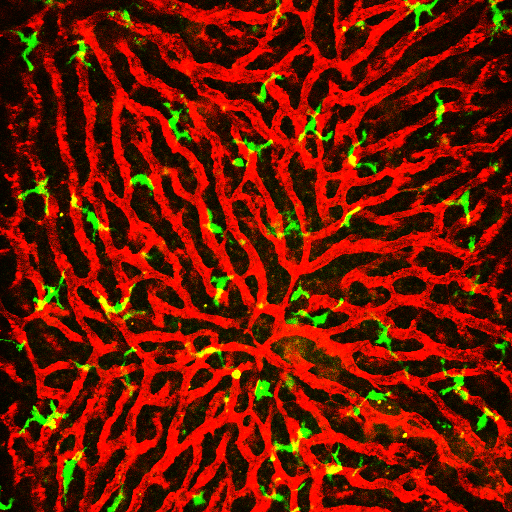
Retina
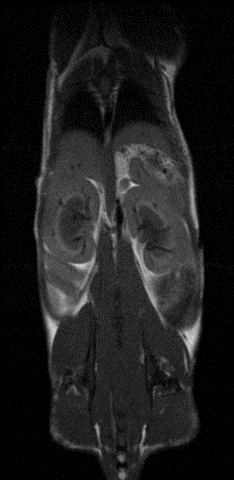
T1 Weighted Image of Normal Mouse Abdomen
T1 Weighted Image of Normal Mouse Abdomen
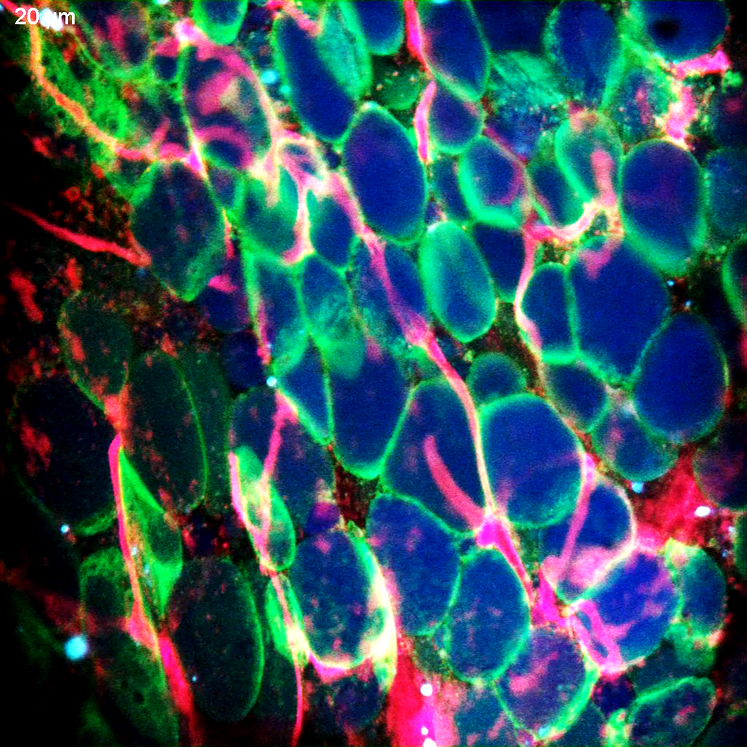
Muscle
Heart
Multimodal Imaging
Multimodal Imaging
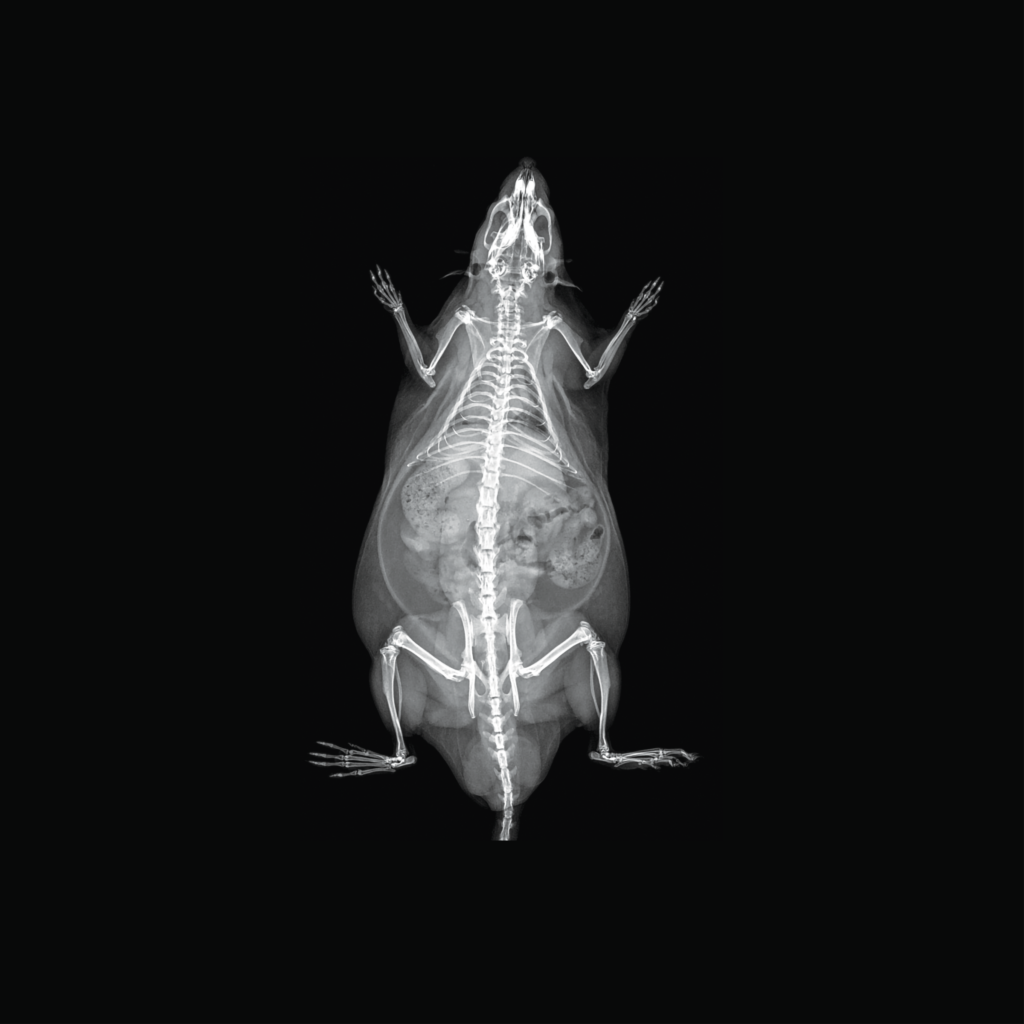
Mouse Scan
Mouse, whole body scan of mouse highlighting image stitching and 3D reconstruction capabilities
Ear Skin
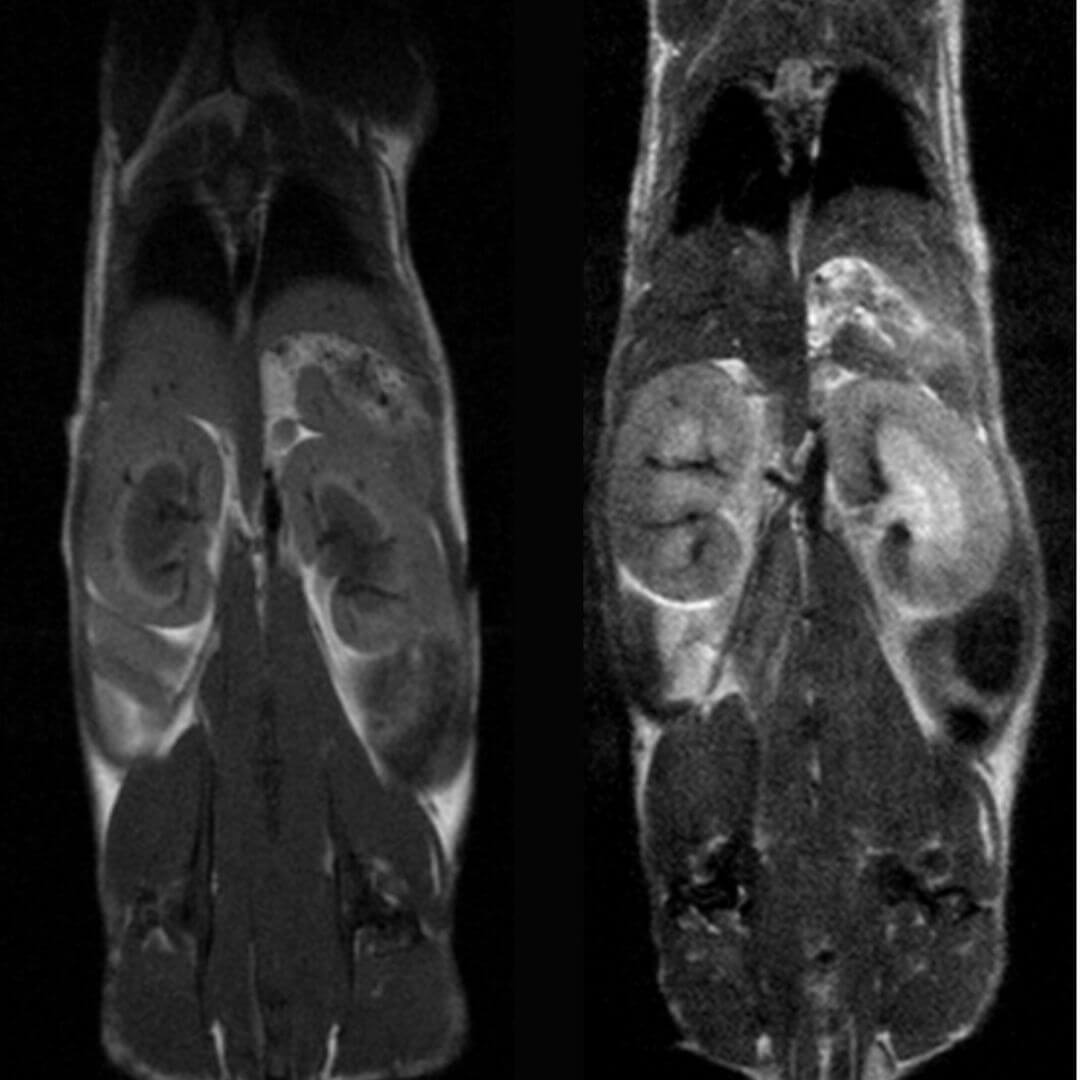
Anatomy & Morphology of mouse abdomen: T1- and T2- weighted scans of wildtype mouse body abdomen
Anatomy & Morphology of mouse abdomen: T1- and T2- weighted scans of wildtype mouse body abdomen
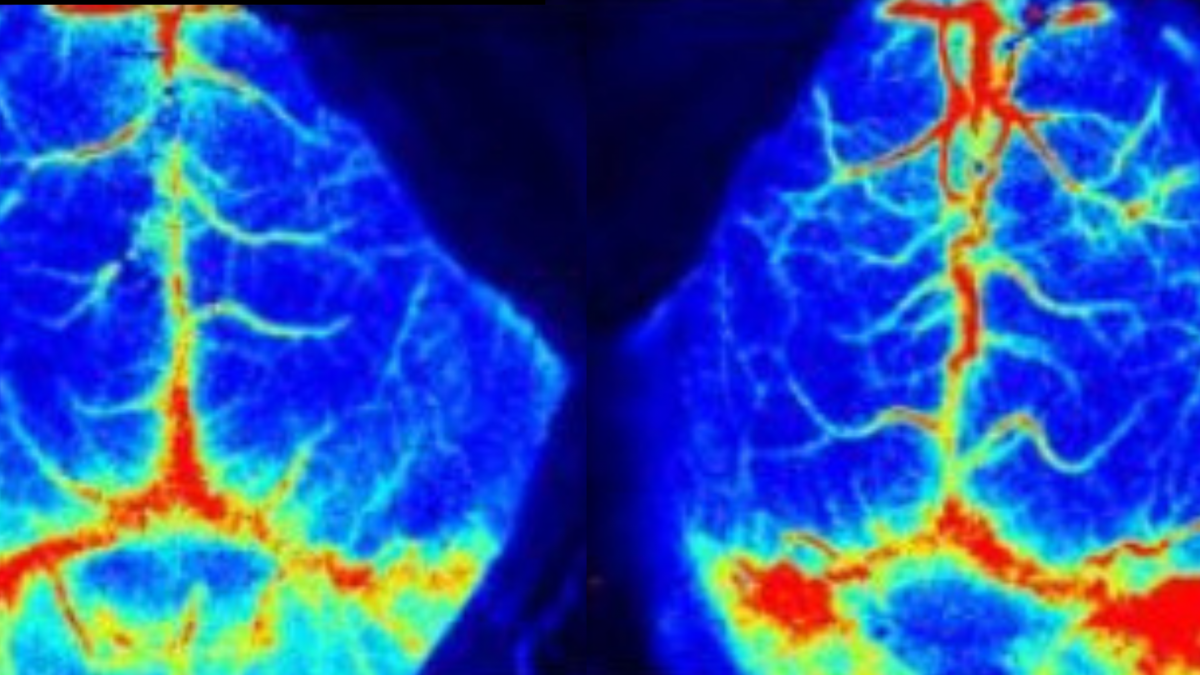
Laser Speckle
BLI of Orthotopic Lung Tumor in Mouse
Imaging Gallery
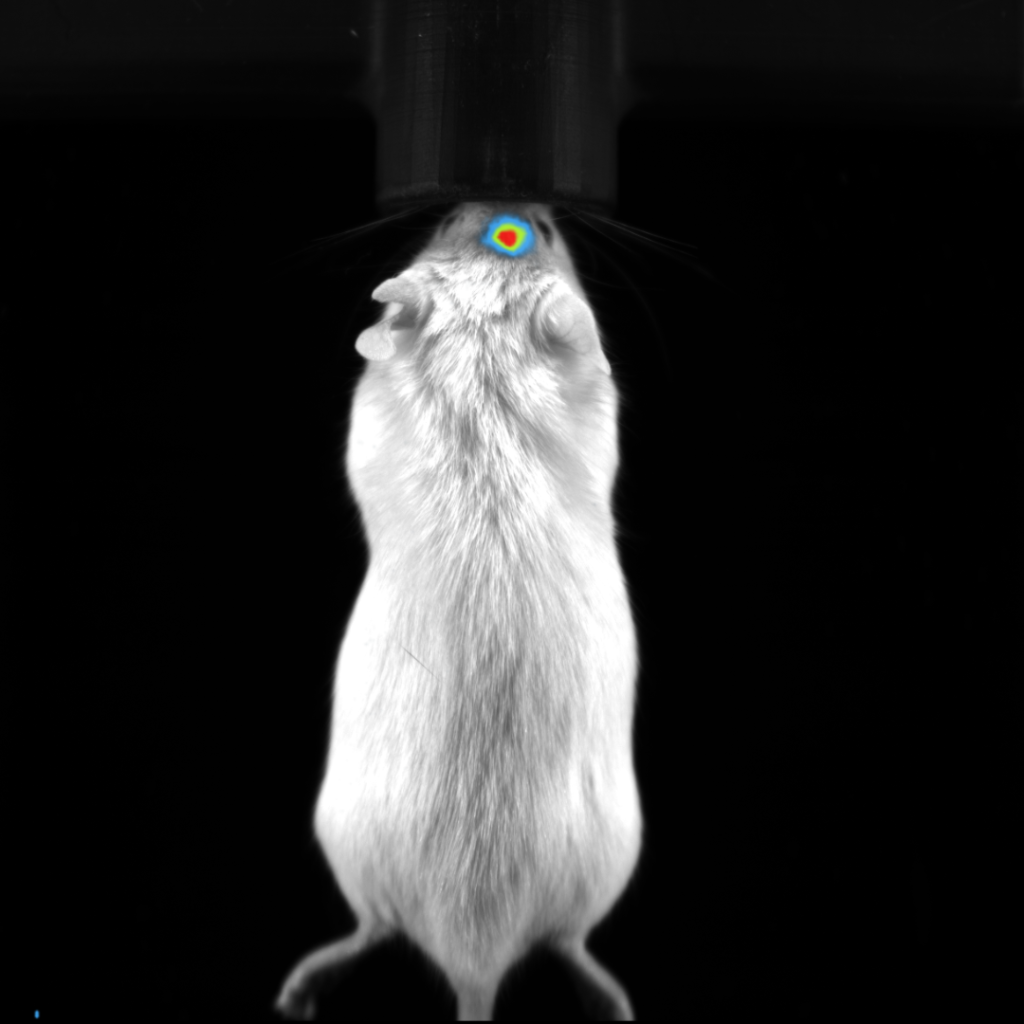
BLI Image of Orthotopic Brain Tumor in Mouse
BLI Image of Orthotropic Brain Tumor in Mouse
M-Mode with Measurements of Systolic Function in the Short Axis of the Left Ventricle of a Normal Mouse
Mouse Left Ventricular Short Axis View in M-Mode
BLI Imaging of Orthotopic Mammary Fat Pad Tumor in Mouse
BLI Imaging of Orthotropic Mammary Fat Pad Tumor in Mouse
B-Mode Image of Orthotopically Implanted Liver Tumor Cells in a Mouse
B-Mode Image of Orthotopically Implanted Liver Tumor Cells in a Mouse
DXA Rat2_Preview
DEXA
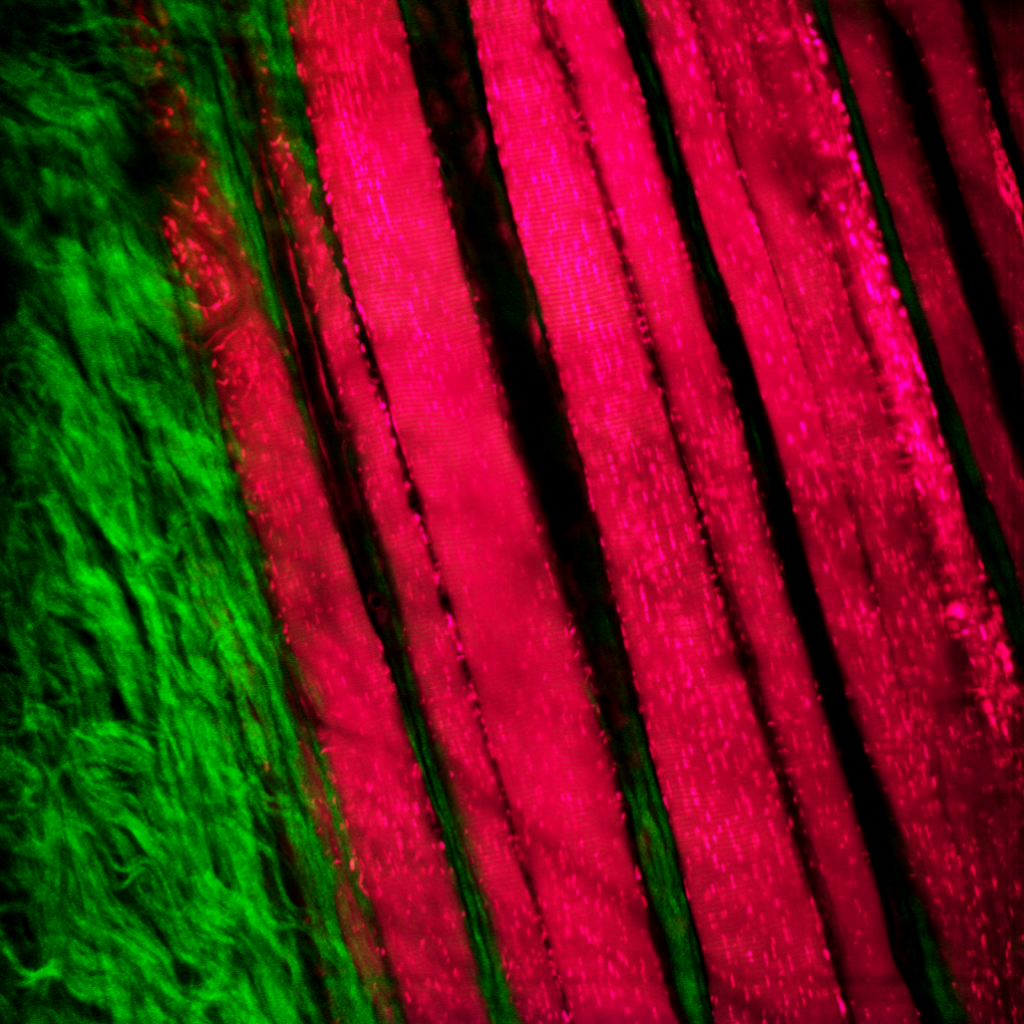
Muscle
Skeletal Muscle
DXA-Rabbit
Intraoperative control image of a rabbit. The position of the intubation can be determined with great precision.
Marmoset Color Image
Marmoset Color Image
BLI Image of Orthotopic Lung Metastases in Mouse
BLI Image of Orthotropic Lung Metastases in Mouse
Multi-Animal mouse Imaging
Lung
Hair Follicle
LS1
Laser Speckle Imaging
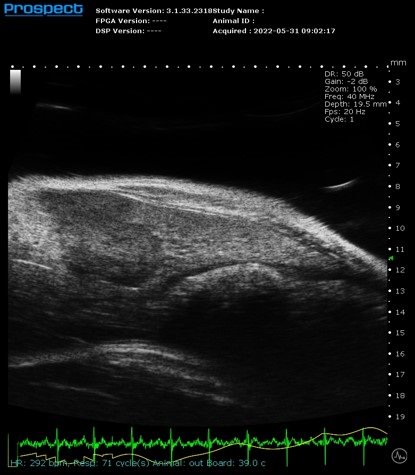
Mouse carotid b
Mouse Carotid Artery in B-Mode
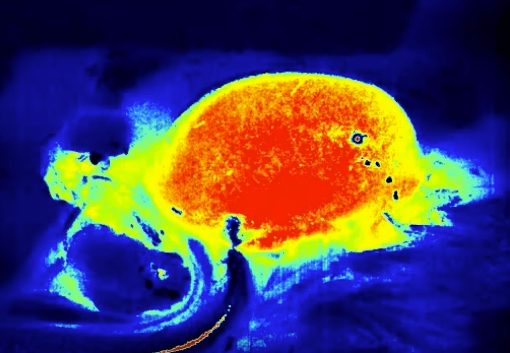
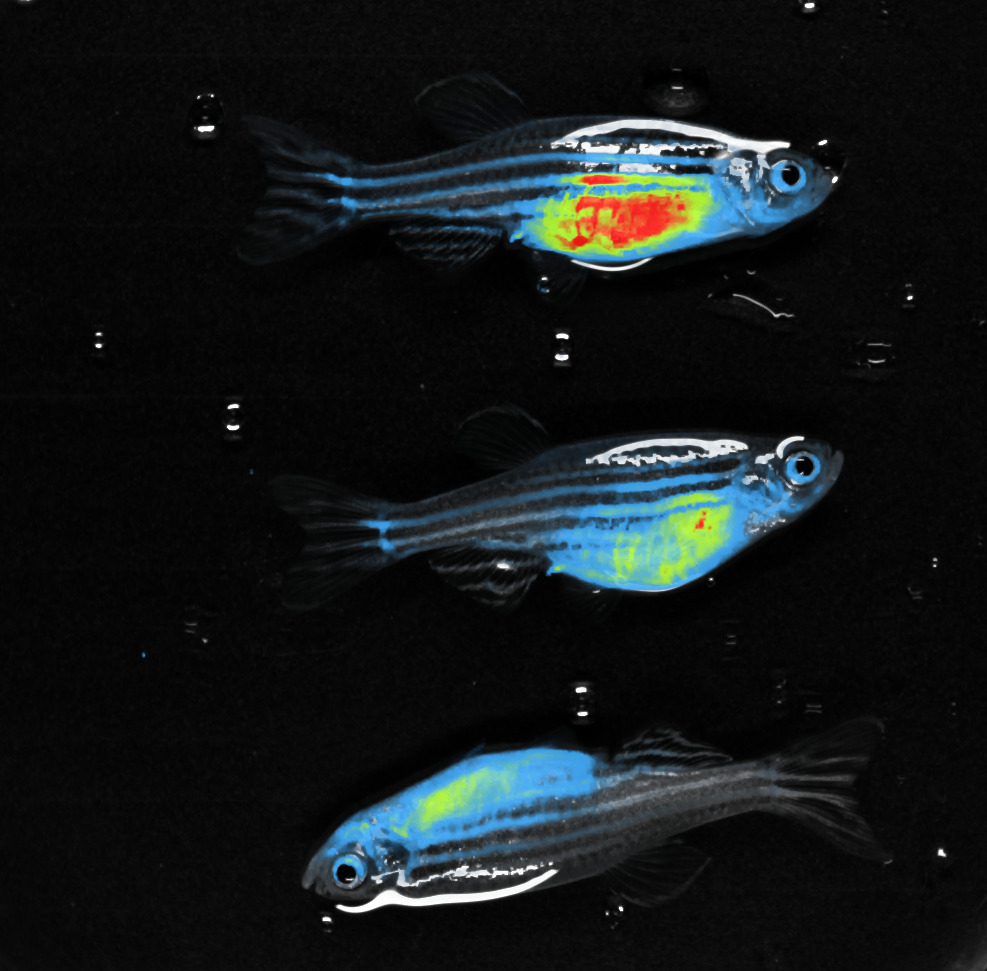
RED FLI - Zebrafishes
RED FLI - Zebrafish
Blood Flow Imaging
Laser Speckle
LS2
Laser Speckle Imaging
Mouse Orthotopic Mammary Fat Pad Tumor in B-Mode; Volume = 263mm3
Mouse Orthotopic Mammary Fat Pad Tumor in B-Mode; Volume = 263mm3
T2 Weighted Image of Normal Mouse Brain
T2 Weighted Image of Normal Mouse Brain
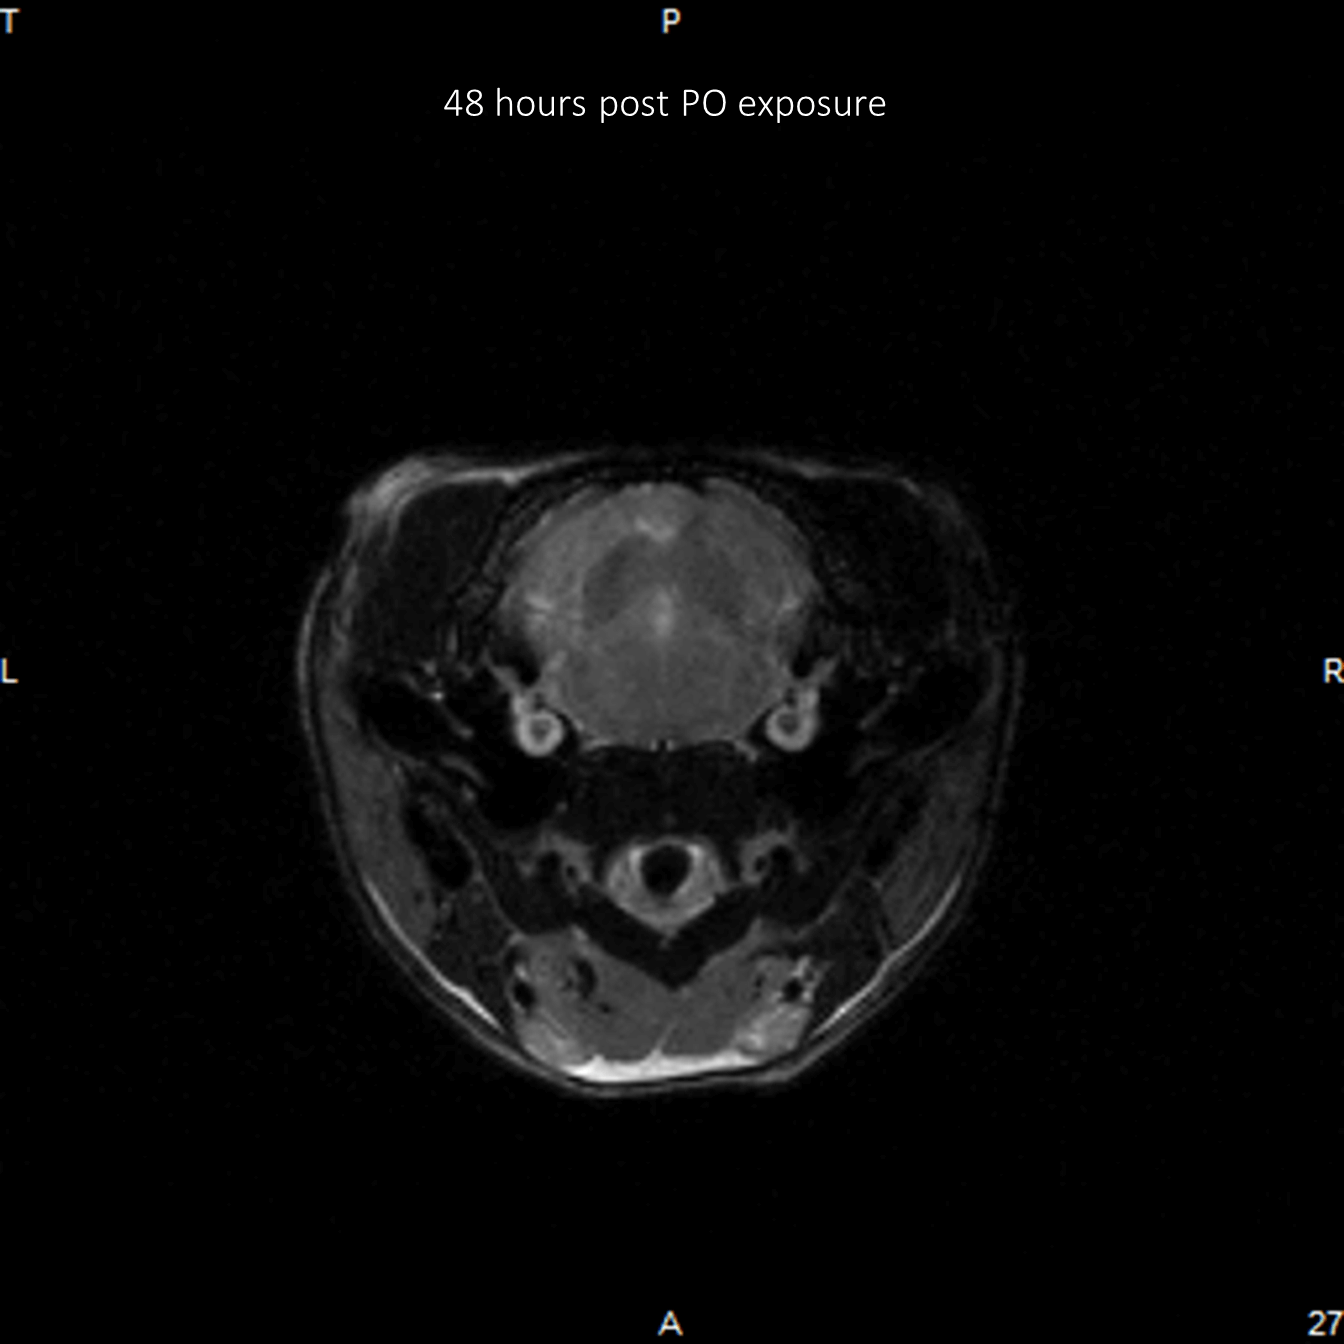
T2 Weighted Image of Rat Brain 48 Hours After Exposure to Paraoxone
T2 Weighted Image of Rat Brain 48 Hours After Exposure to Paraoxone
Liver
Mouse Embryo E15 in B-Mode
Mouse Embryo E15 in B-Mode
Small Intestine
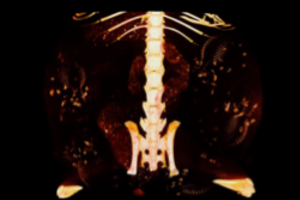
Bone mineral Density Image
Bone mineral Density Image
532nm Full Body
Photoacoustic
Ex vivo imaging - MRI
Ex Vivo Imaging
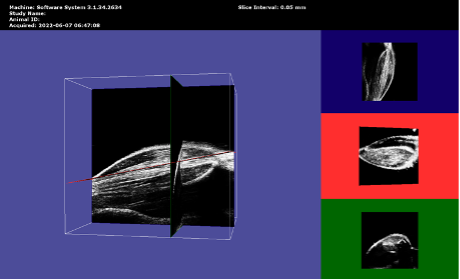
3D B-Mode Image of the Hind Limb Image of the Mouse
3D B-Mode Image of the Hind Limb Image of the Mouse
Mouse Left Ventricular Long Axis View in B-Mode
Mouse Left Ventricular Long Axis View in B-Mode
Muscle
1064nm Composite
Long Axis View of Left Ventricle in Normal Mouse
T2 Weighted Image of Rat Brain 48 Hours After Exposure to Paraoxone
Lymph Node
Brain
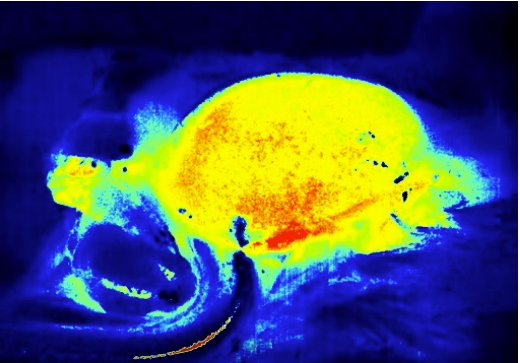
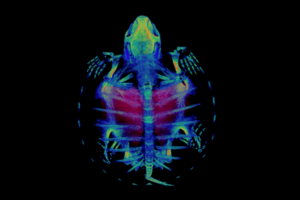
Turtle
Turtle, Image of 4.28cm turtle with 22.5 µm resolution at a 20 second scan time. Image color was based on density with additional software
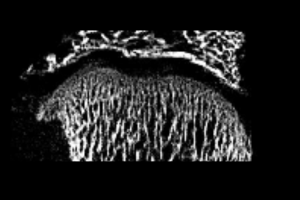
Ex Vivo Model
Obtain higher resolution faster in a dedicated area of your sample. Sub-volume reconstruction with 2 µm voxel size resolution on a 15 µm ex vivo mode image
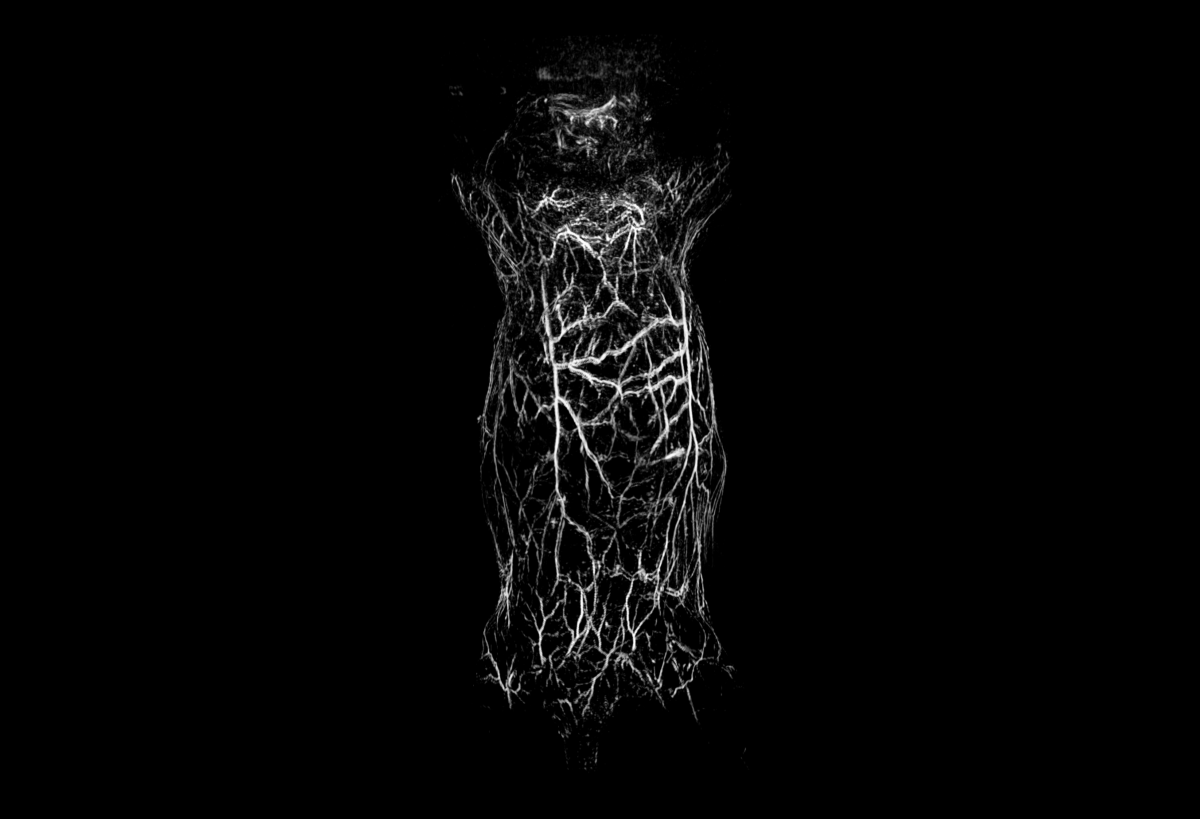
Lymphatic Drainage
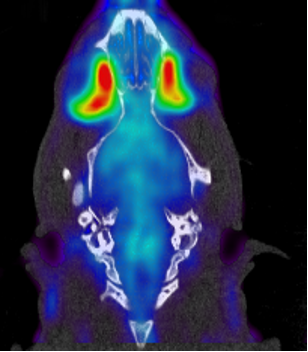
MultPlex PET
Showing only Dopamine Transporters from Combined Acquisition
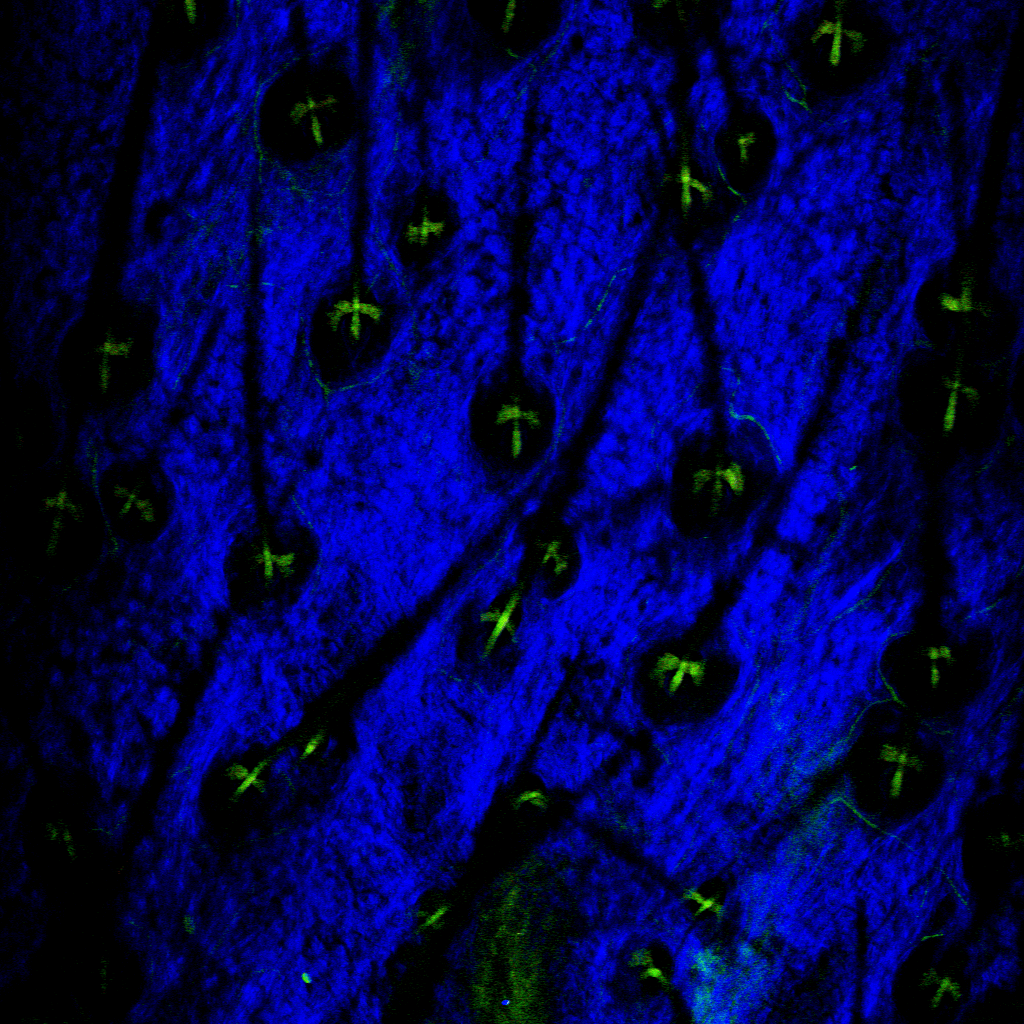
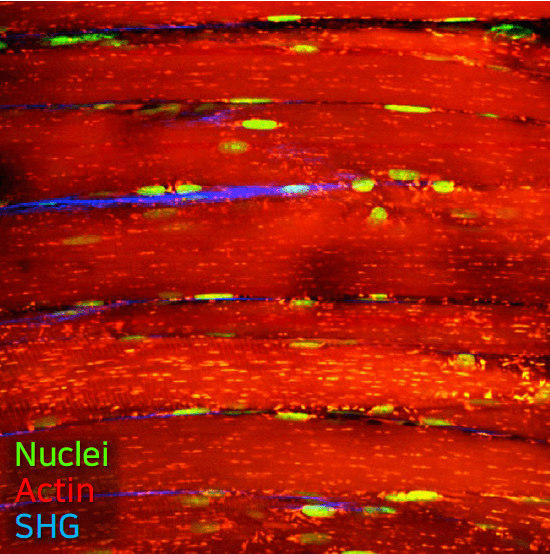
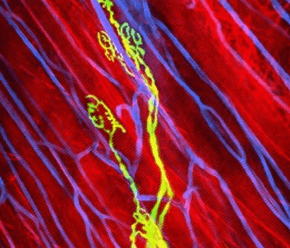
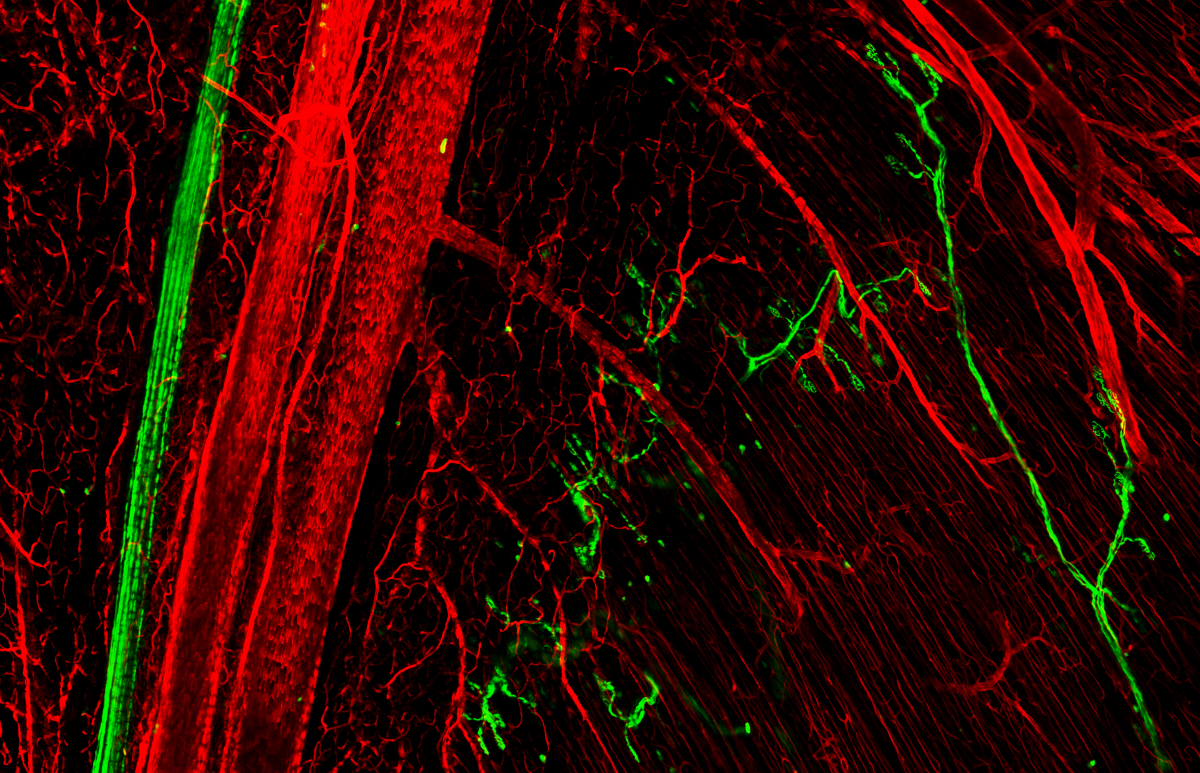
Muscle-Nerve
Spleen
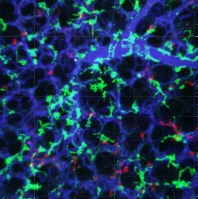
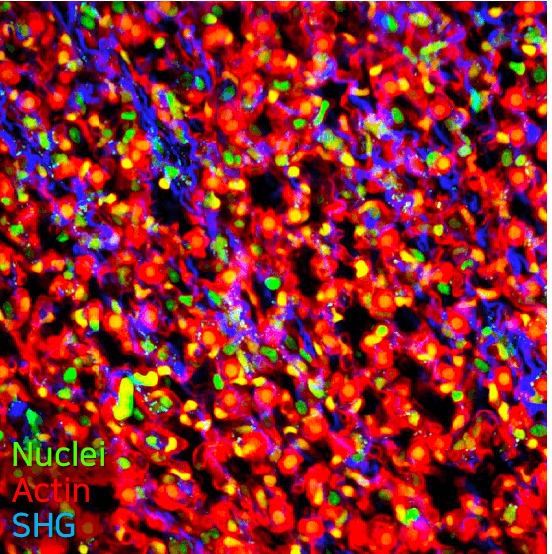
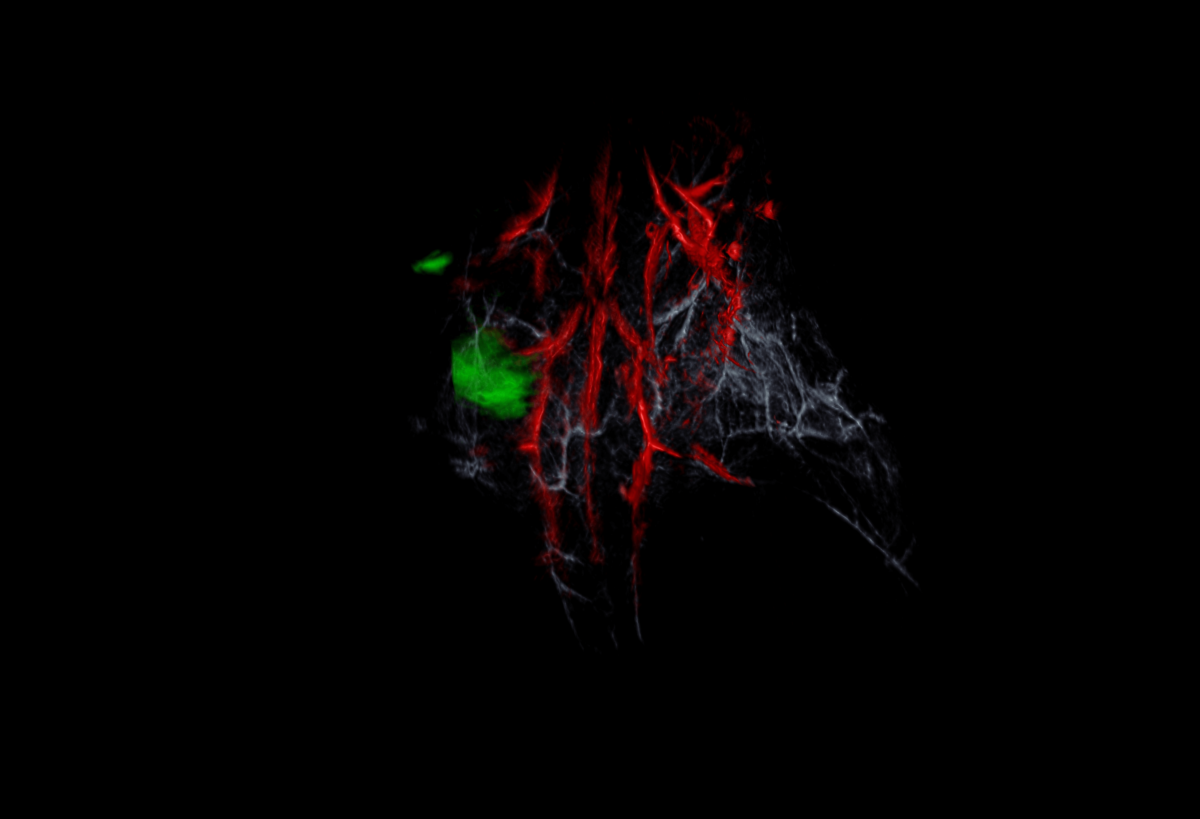
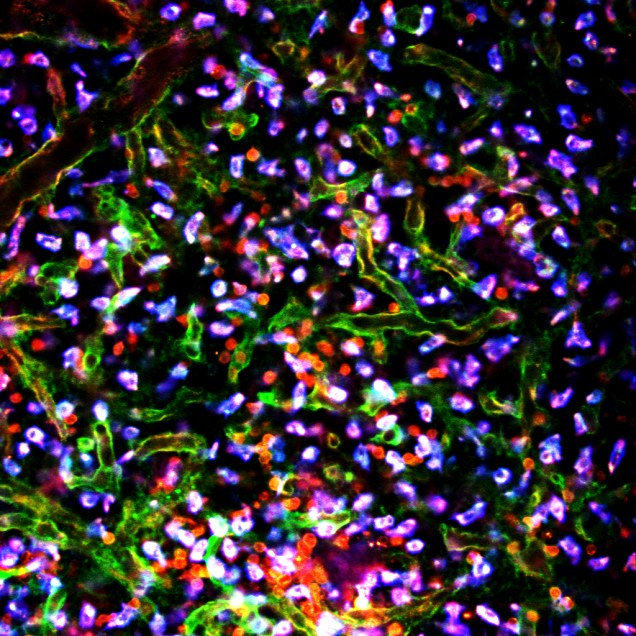
Liver Fibrosis with Collagen and Lipid Droplets Labelled
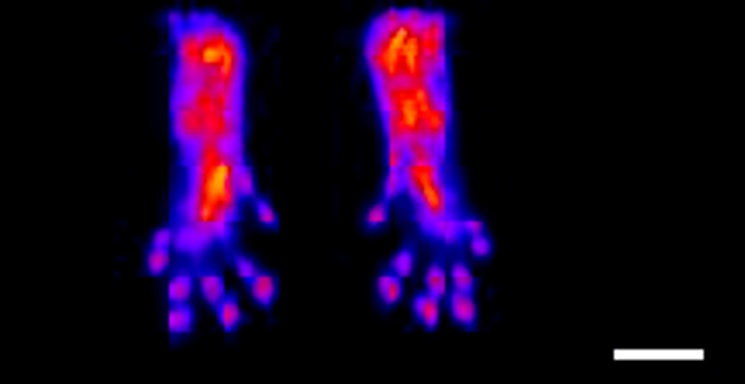
Arthritis Inflammation in Rat Paws
Mouse Left Ventricular Long Axis View in B-Mode
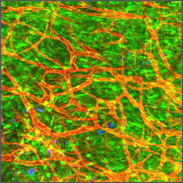
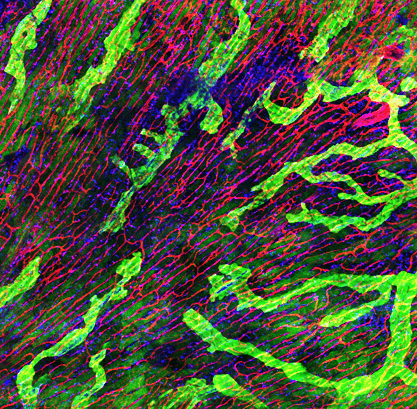
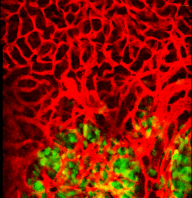
Tumor Vasc
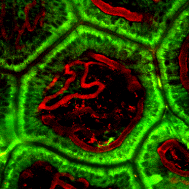
Kidney
T1 Weighted Image of Normal Mouse Abdomen
MRI
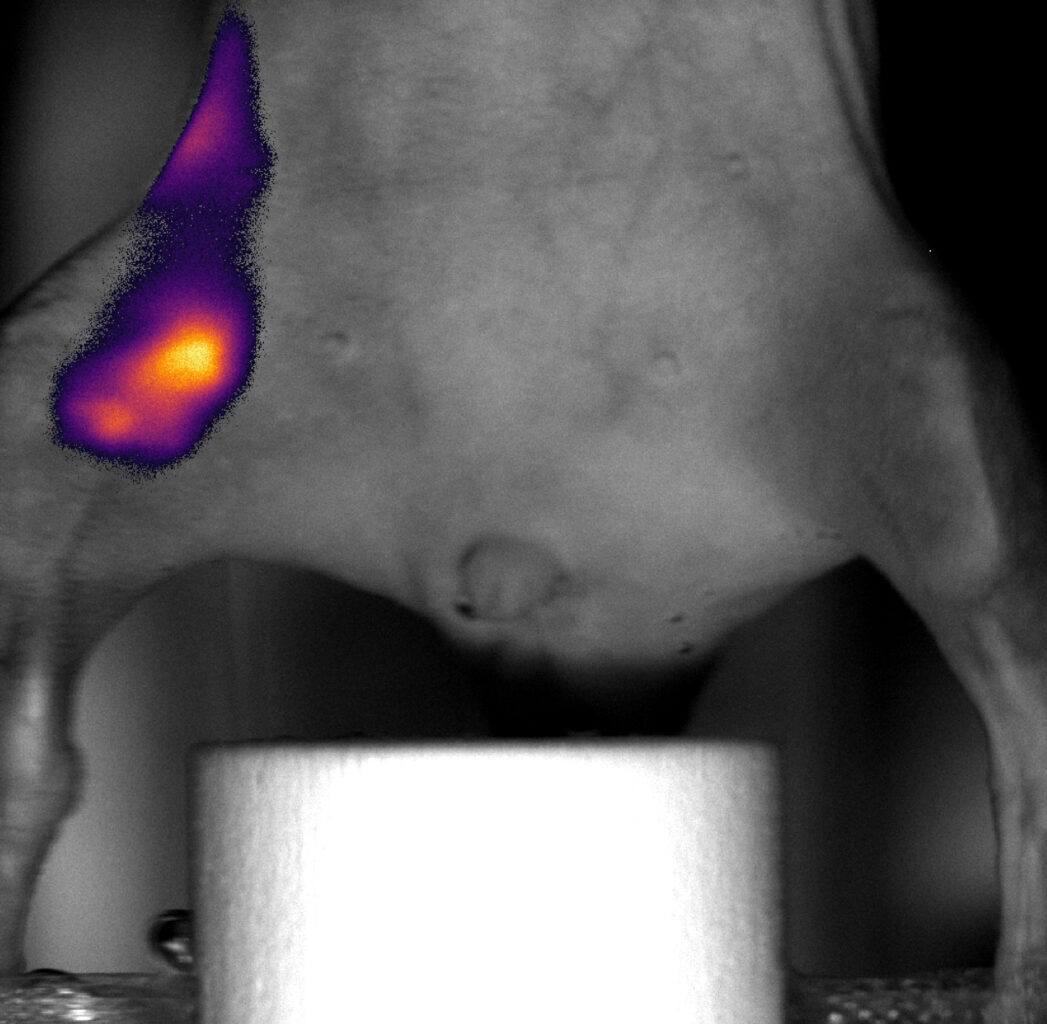
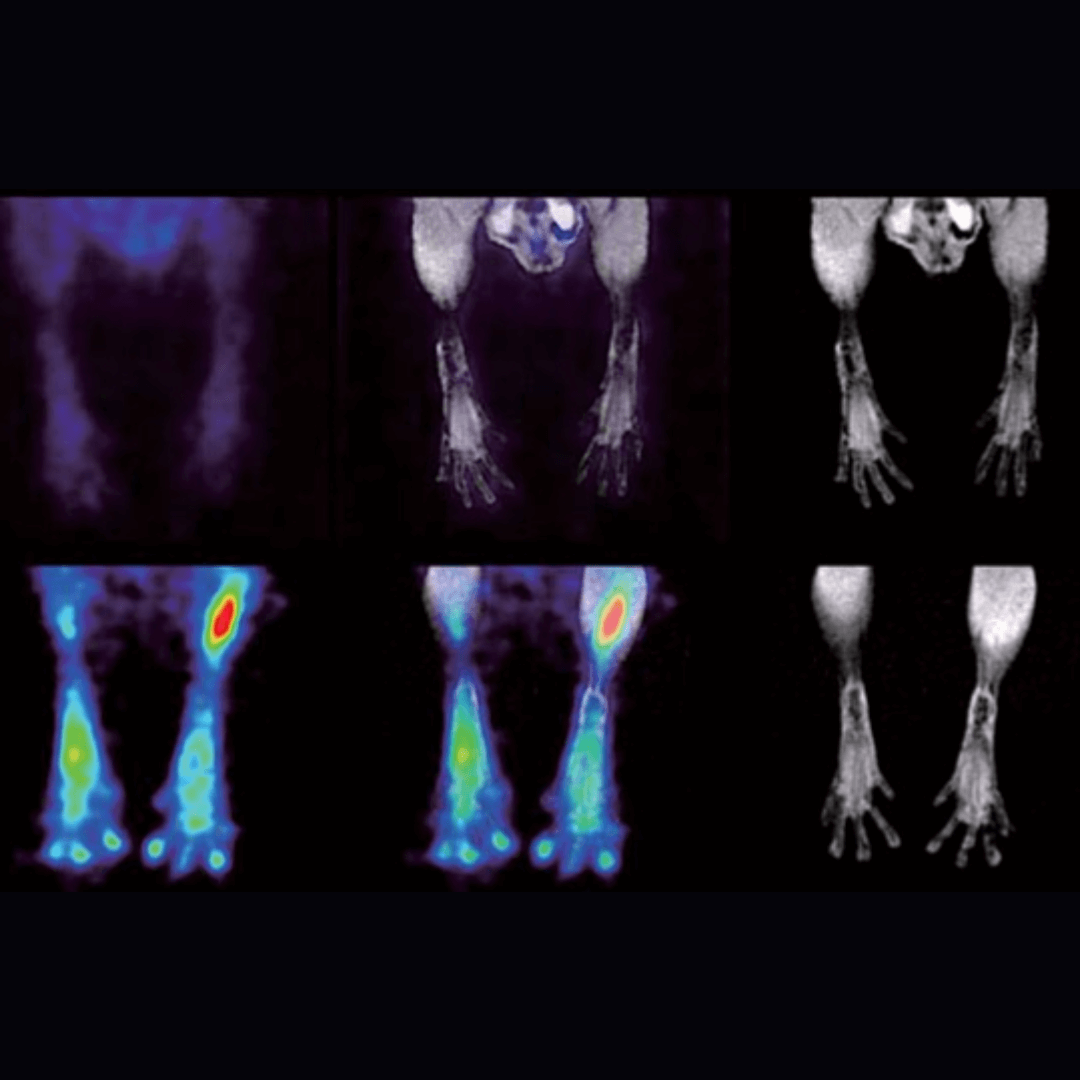
FDG in Rat with Subcutaneous Tumor on Hind Limb
Fluorescent Nanoprimer Distribution After IV Injection in Mouse
Fluorescent Nanoprimer Distribution After IV Injection in Mouse
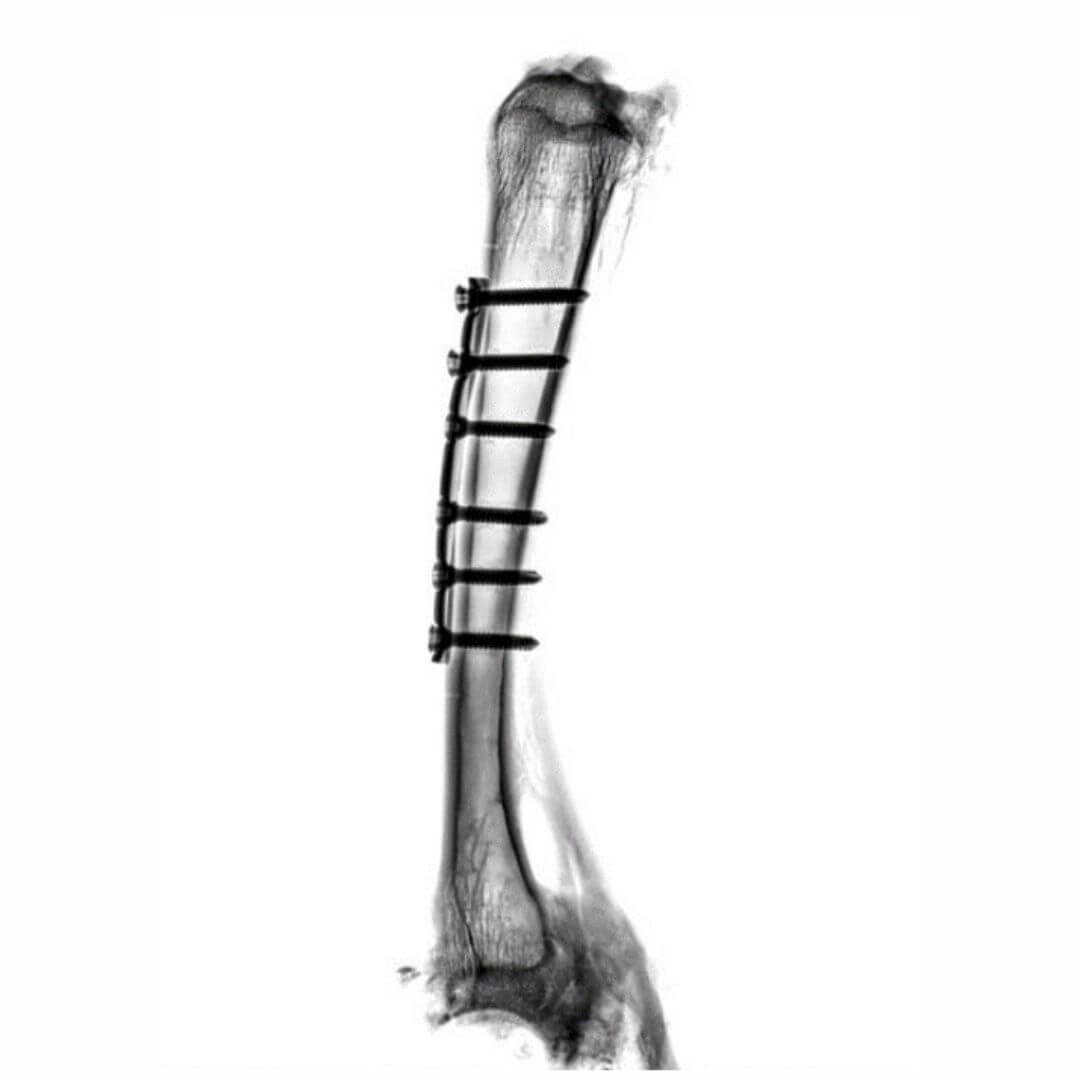
DXA-Bone
Implants on a sheep bone. The fit of the implants, the progress of healing and fissures on the screw connections are clearly visible.
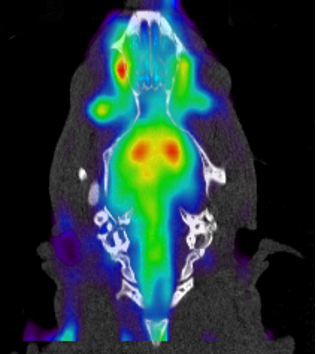
MultPlex PET Showing FDG and Dopamine Transporter in Combined Acquisition
PET/CT
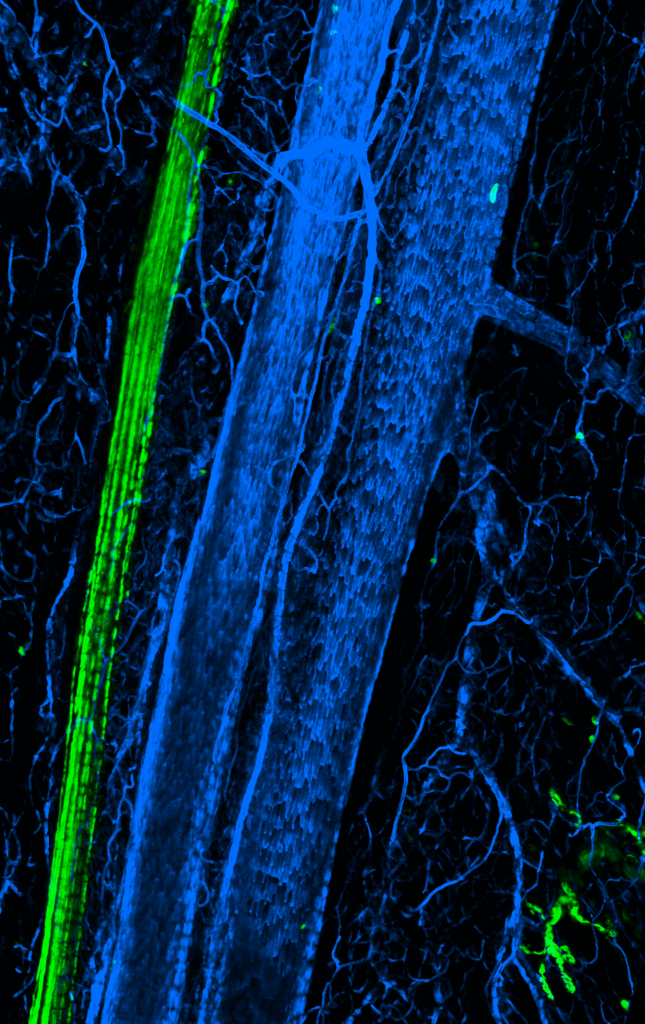
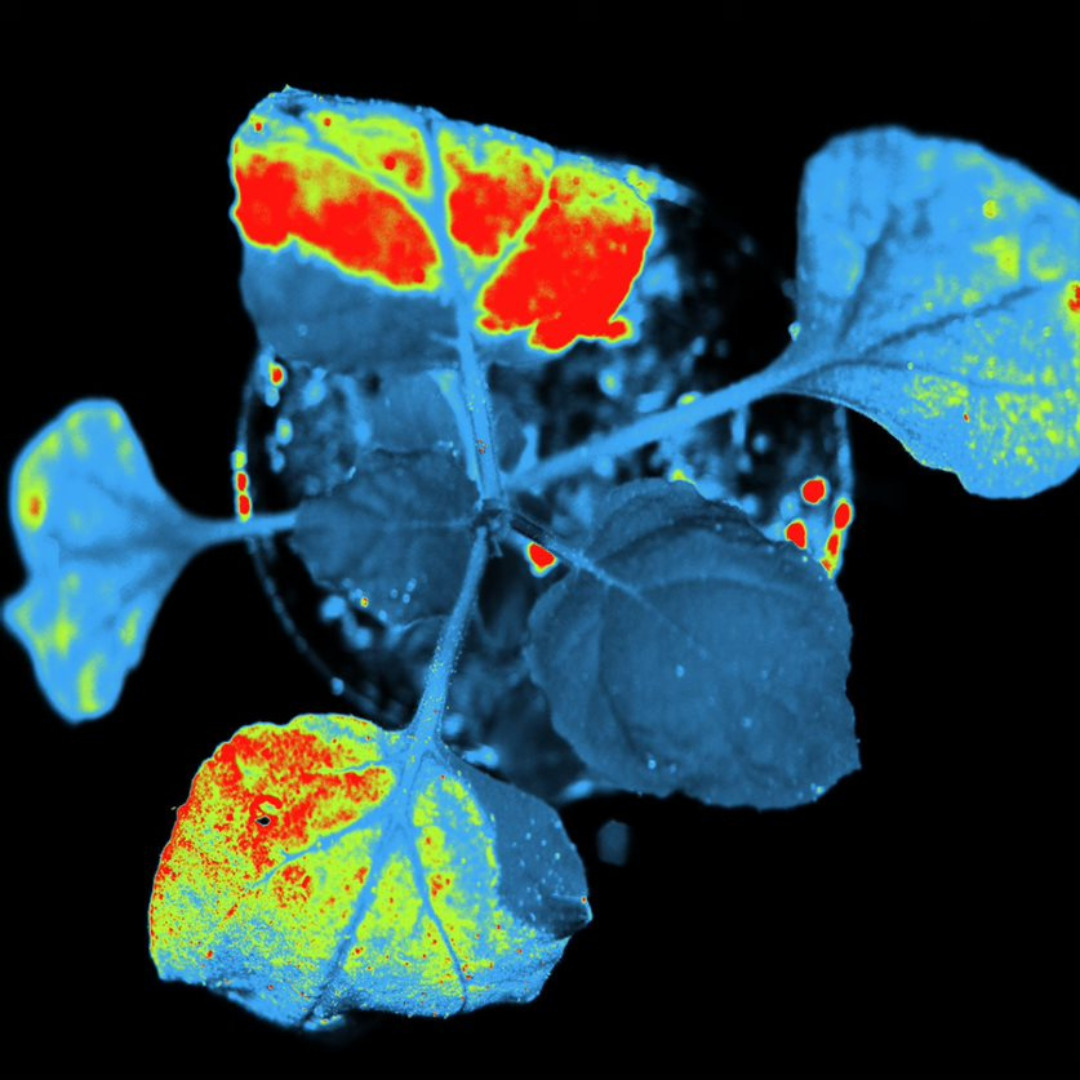
Plant
Plants- TUYV GFP Pot
Skin
Animal Models
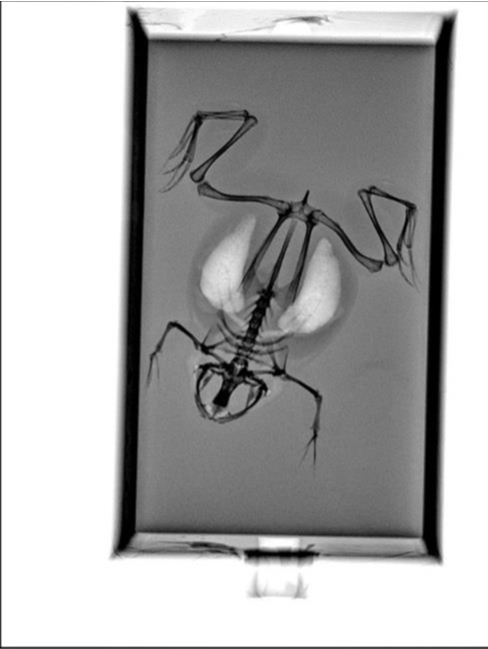
Marmoset X-Ray
Marmoset X-Ray
Zebrafish b-mode
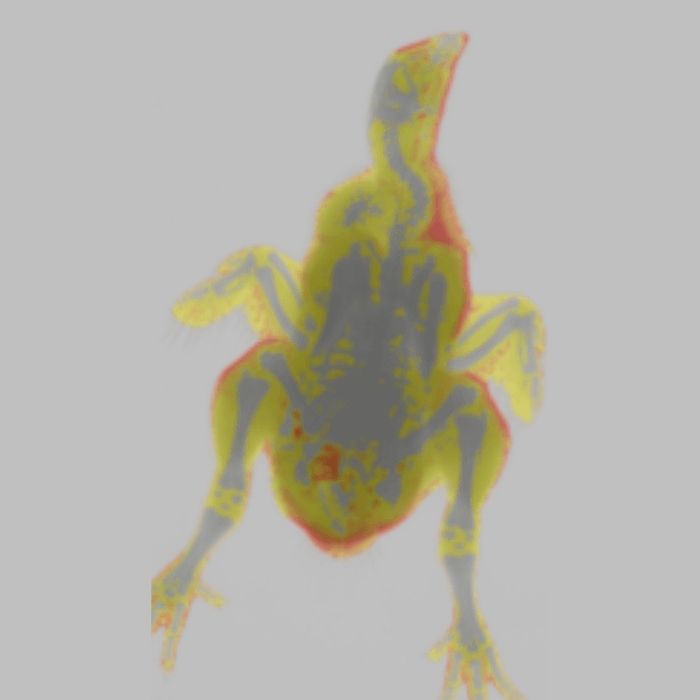
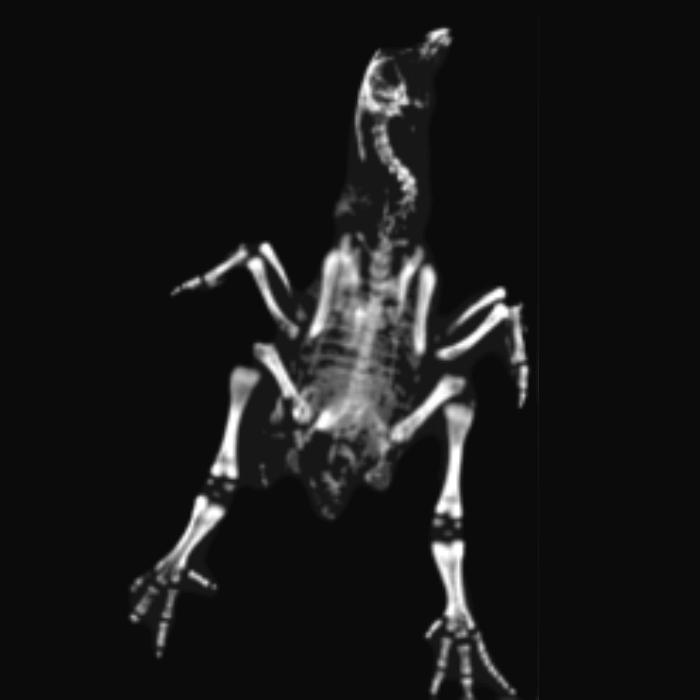
Live Clawed Frog in Water Basin
Live Clawed Frog in Water Basin
Long Axis View of Left Ventricle in Normal Mouse
T2 Weighted Image of Rat Brain 48 Hours After Exposure to Paraoxone
default_view_enhance_low_energy
X-Ray Attenuation Image
DXA-Rabbit
Intraoperative control image of a rabbit. The position of the intubation can be determined with great precision.
T2 Weighted Image of Rat Brain 48 Hours After Exposure to Paraoxone
T2 Weighted Image of Rat Brain 48 Hours After Exposure to Paraoxone
Chicken Color Image
Chicken Color Image
T1 Weighted Image of Normal Mouse Abdomen
MRI
Marmoset Color Image
Marmoset Color Image
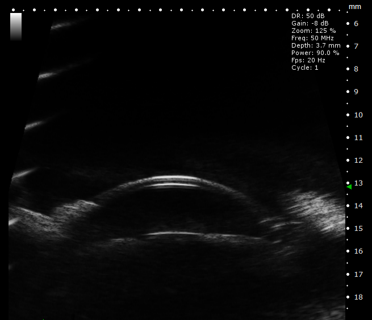
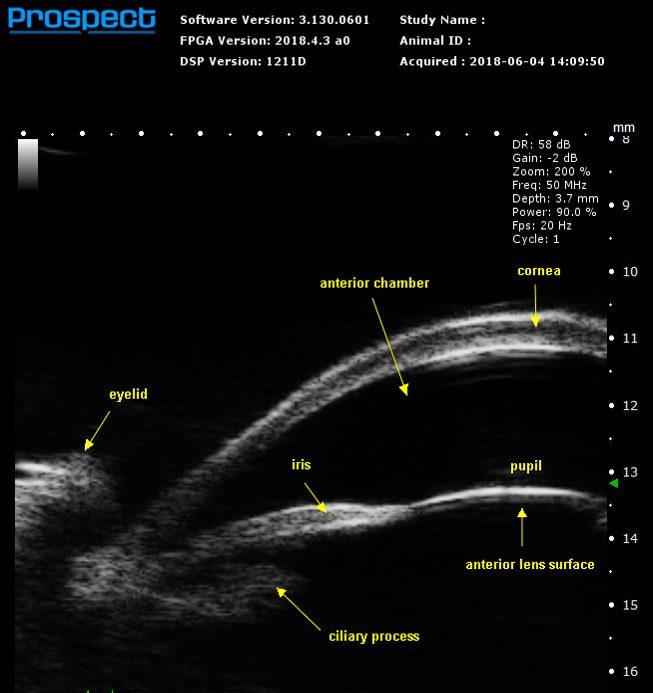
Rabbit Anterior Structure of Eye in B-Mode
Bone mineral Density Image
Bone mineral Density Image
RED FLI - Zebrafishes
RED FLI - Zebrafish
T1 Weighted Image of Normal Mouse Abdomen
T1 Weighted Image of Normal Mouse Abdomen
Rat Color Image
Rat Color Image
Chicken Bone Mineral Density
Chicken Bone Mineral Density
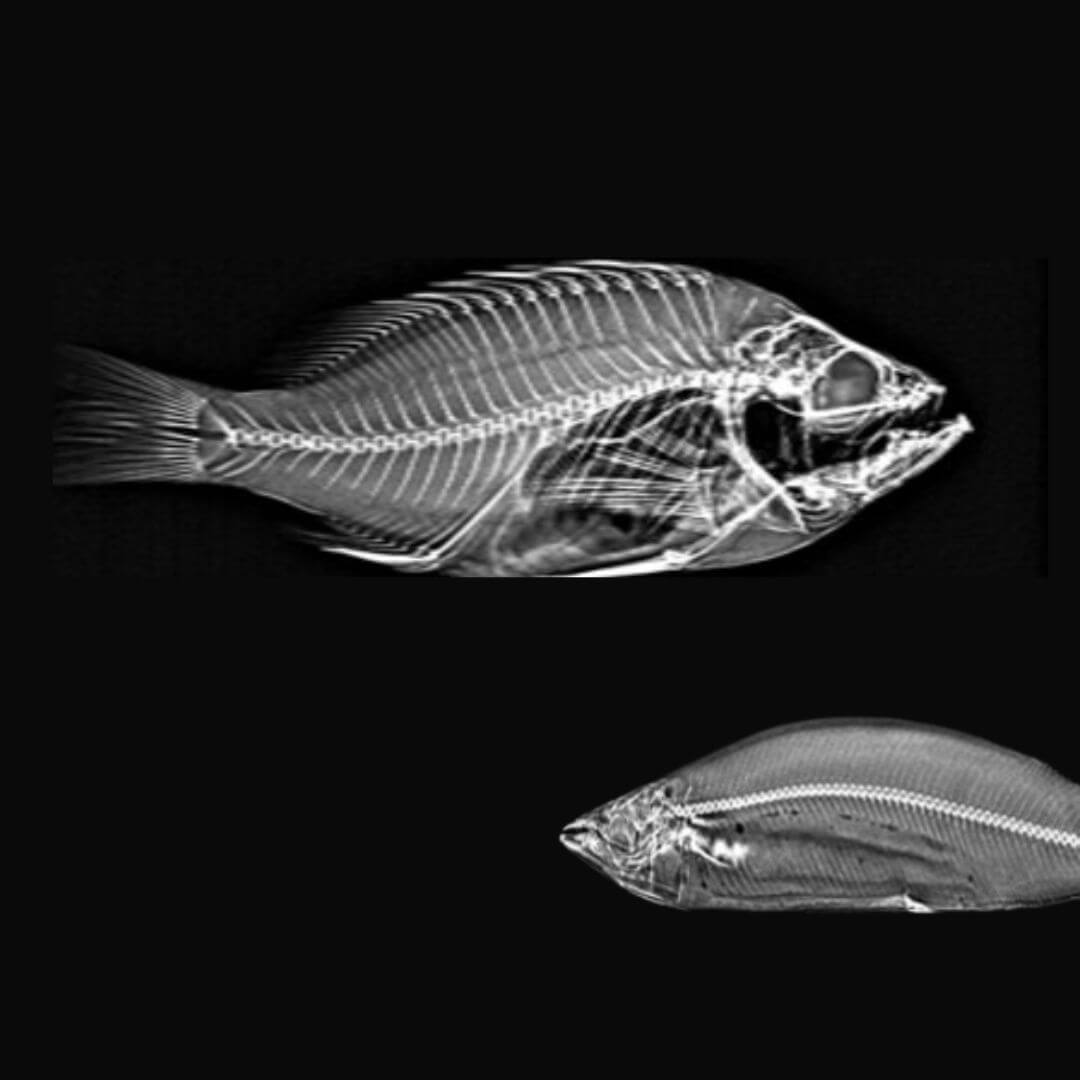
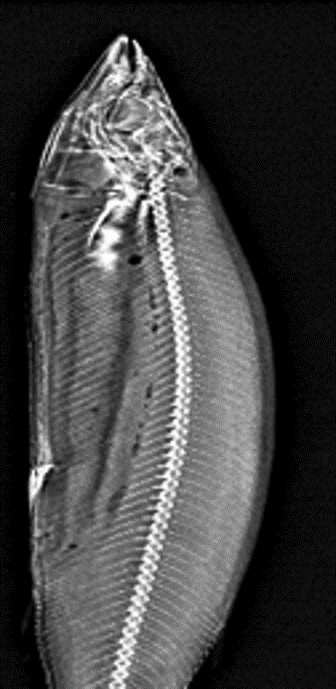
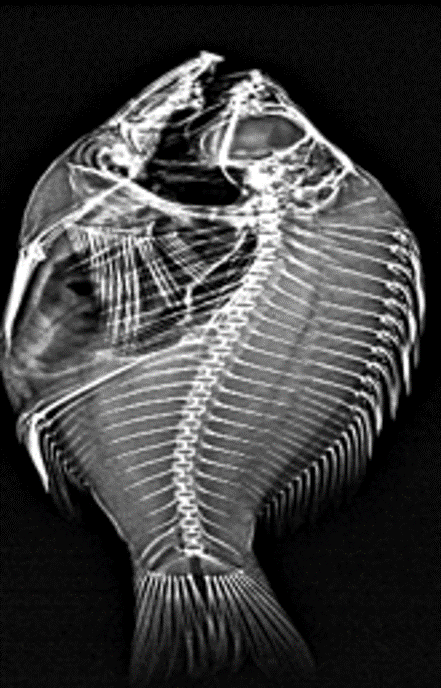
Fish X-Ray
Fish X-Ray
T2 Weighted Image of Normal Mouse Brain
T2 Weighted Image of Normal Mouse Brain
T2 Weighted Image of Normal Mouse Brain
T2 Weighted Image of Normal Mouse Brain
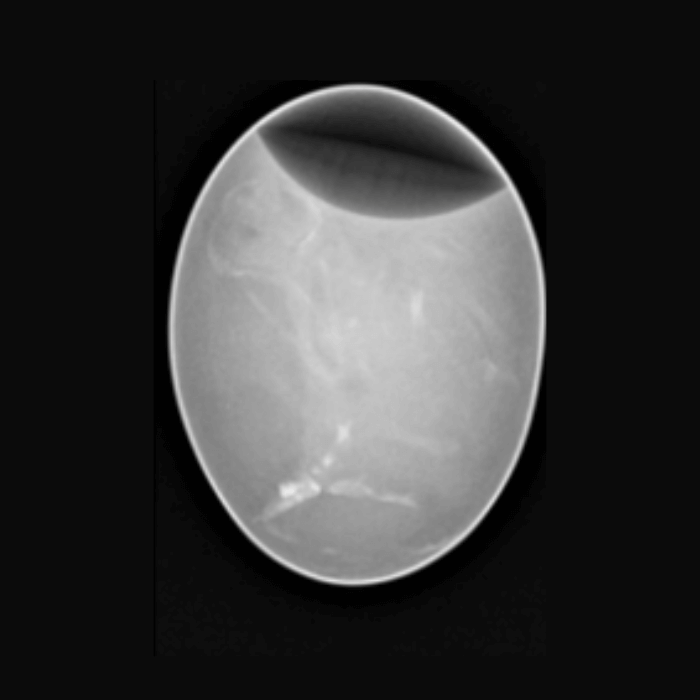
X- Ray Chicken Egg
Chicken Egg
Rabbit eye b-mode
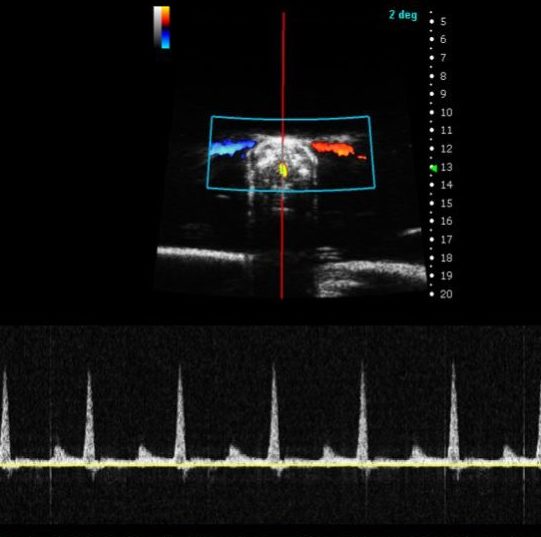
zebrafish PW of ventricular inflow
Fish X-Ray
Fish X-Ray
DXA Chicken
Chicken X-Ray
DXA-Fish
DXA Rat2_Preview
DEXA
Resources: Articles, Webinars & Events
Scintica has a strong focus on education within science and the roles that various technologies play in advancing science.